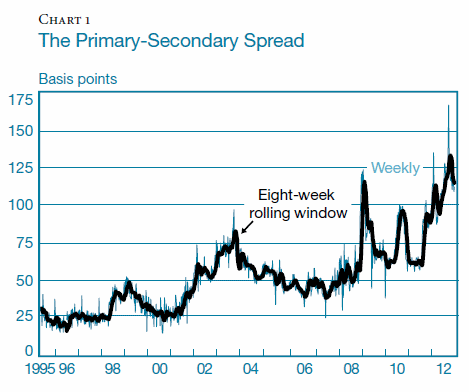
Primary-Secondary Spread is the difference between an average mortgage interest rate and a representative yield on newly issued agency mortgage-backed securities (MBS) based on that loan and others like it (aka "current-coupon rate"). This spread remained relatively stable from 1995 to 2000 at about 30 basis points then widened to about 50 basis points through early 2008. In 2009 it soared to 100 basis points and in 2012 following the announcement in September of that year that the Federal Reserve would make additional MBS purchases it spiked temporarily to 150 basis points, a historic high.

While the primary-secondary mortgage rate spread is closely tracked, six analysts* from the Federal Reserve Bank of New York say it is an imperfect measure of the pass-through between secondary-market valuations and primary-market borrowing costs. They tracked cash flows during and after the mortgage origination and securitization process to determine how many dollars (per $100 loan) are absorbed by originators either to cover costs or as originator profits.
According to the authors of The Rising Gap Between Primary and Secondary Mortgage Rates, there are several reasons why the rate spread measure is an imperfect proxy for the degree to which secondary market movements are reflected in mortgage borrower costs (the pass through). First, the secondary yield is not directly observed but model-determined and thus subject to model misspecification. That means that it's subjectively determined based on various firms' perceptions of how the changing financial climate might impact borrower behavior.
Pass-through also depends on the evolution of the GSEs' guarantee or "g" fees and on mortgage originators' margins. G-fee changes are easily observable but the originator's margin depends on the price at which they can sell their loans rather than the interest rate or the security into which the loans are sold. Therefore the authors opted to track the two components separately.
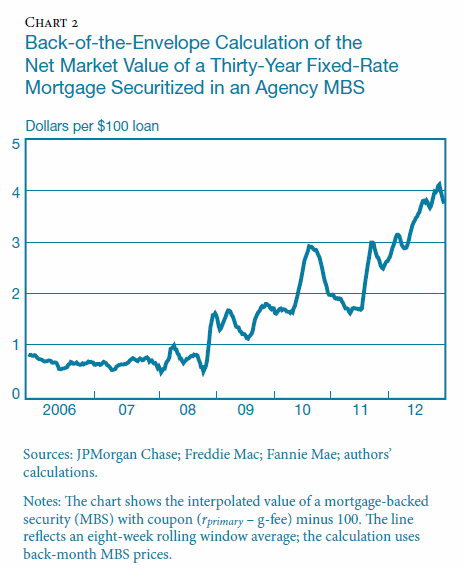
The authors conducted a "back-of-the-envelope" calculation to get a sense of what lenders earn from selling loans, tracking the secondary market value of the typical mortgage loan over time. They assume that the lender securitizes and sells the loan as an agency MBS, so they first deducted the g-fee from the loans interest stream then computed the value of the remaining stream by interpolating MBS prices across coupons and deducting the model loan amount of $100. The chart below shows that the approximate net market value of a mortgage grew from less than 100 basis points before 2009 to more than 350 basis points in the second half of 2012. Taken literally, this implies that lender costs outside of g-fees, lender profits, or a combination of the two must have increased by 300 basis points, or quadrupled in five years.

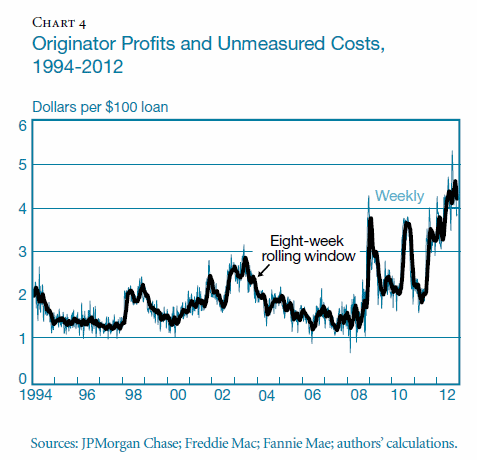
The authors looked at the valuation of revenues from servicing and points and at costs from g-fees and derived a time series of average originator profits and unmeasured costs (OPUCs) for the period 1994 to 2012. It then compared OPUCs and the primary-secondary spread as measures of mortgage market pass-through. They then looked for possible explanations for the increase in OPUCs over that period including putback risks, changes in the valuation of servicing rights, pipeline hedging costs, capacity constraints, market concentration, and streamline refinancing programs. While some of the costs faced by originators may have risen over the period 2008-2012, the authors concluded that a large part of the rise in OPUCs remains unexplained by those cost increases alone suggesting that originators' profits likely increased over this period.

In The purpose of the OPUC measure is to track how many dollars per $100 loan get absorbed by originators and by g-fees. Increasing g-fees means less money goes to borrowers or they need to pay a higher rate. So full pass-through of secondary-market movements to borrowers would require OPUCs and g-fees to remain constant or that a rise in one be offset by a decrease in the other.
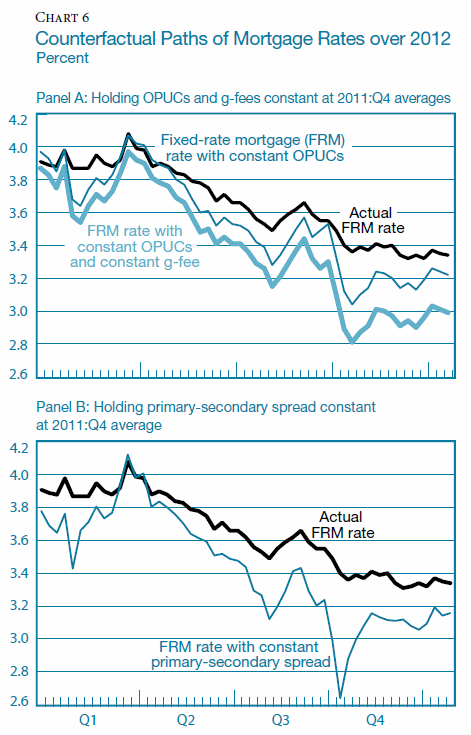
The authors constructed a counterfactual exercise computing a hypothetical survey rate during 2012, assuming that either the OPUCs only (dark blue line) or both g-fees (light blue line) had stayed at average 2011:Q4 levels. The authors point out that "the comparison of the light blue line with the black line, the actual realized mortgage rate, shows that had the cost of mortgage intermediation stayed constant relative to 2011:Q4, mortgages rates during 2012 would at times have been substantially lower, with a maximum gap between the two rates of 55 basis points in early October 2012."

When the black line is compared with the dark blue line, holding OPUCs steady or letting g-fees increase, over most of 2012 much of the gap between the actual and the counterfactual rate derives from the rise in OPUCs.
When rates are stable or increasing, the counterfactual rate with constant OPUCs tends close to the actual rate and most of the gap between the two blue lines comes from higher g-fees. It is during times when rates fall (secondary market prices increase) that actual rates do not fall as much as they would with constant OPUCs. This is consistent with originators having limited capacity.
In the second panel of the chart the counterfactual analysis uses the primary-secondary spread as the measure of mortgage intermediation costs. This model is more volatile with the gap between the actual and counterfactual rates spiking at 75 basis points in September 2012.
The widening gap between primary and secondary mortgage rates between 2008 and 2012 was due to a rise in OPUCs as well as increases in g-fees. The magnitude of the OPUCs is influenced by MBS prices, the valuation of servicing rights, points paid by borrowers, and costs such as from loan putbacks and hedging.
The most significant driver of increases in OPUCs was higher MBS prices which were not offset by increases in measurable costs. A decline in servicing rights have reduced OPUCs to some extent but among harder-to-measure costs the authors found little effect from putback costs and pipeline hedging. Absent cost explanations, the authors conclude the rise in OPUCs reflected an increase in originator profits. Market concentration alone does not explain these profits but capacity constraints do appear to have played a significant role. There are also indications that originators had some pricing power over refinancing borrowers due to borrowers' switching costs.
*Andreas Fuster and David Lucca are senior economists in the Federal Reserve Bank of New York's Research and Statistics Group; Laurie Goodman is the center director of the Housing Finance Policy Center at the Urban Institute; Laurel Madar and Linsey Molloy are associates in the Bank's Markets Group; Paul Willen is a senior economist and policy advisor in the Federal Reserve Bank of Boston's Research Department.


