
How much does the roof over your head, today help ensure you will still have one in retirement? That is the question the Urban Institute (UI) is trying to answer in a new study of Home Equity Patterns among Older American Households that was commissioned by Fannie Mae. The study examines the role that home equity could play in improving retirement security, and the amount of that equity retirees hold today and will likely hold in the future. It also looks at homeowner behavior and seeks to identify barriers to extracting home equity, both of which could limit retirees' ability to use that equity to finance retirement spending.
The study was conducted by two members of UI's Income and Benefits Policy Center, Barbara A. Butrica a senior fellow and economist, and Stipica Mudrazija a research associate. It is based on the Health and Retirement Study (HRS) sponsored by the National Institute on Aging and conducted by the University of Michigan which has interviewed respondents and their spouses in alternate years since 1992. UI used interview data spanning 1998 through 2012, for households in which either the respondent or spouse was at least 65 years old, selecting the younger partner when both were above that age.
UI intends to issue multiple reports from the study. This article summarizes the first part of the initial report which looks at homeownership, equity, and mortgage debt.
For most adults nearing retirement, a home is their most valuable asset. Relatively few retirees tap into their home equity, but having it provides financial security. Future generations however, may have less ability to utilize it to help finance their retirement. They have more mortgage debt than their predecessors and have not paid down their debt in traditional fashion, shifting their approach to homeownership toward refinancing. Recent data show not only that today's older Americans are more likely than their predecessors to have outstanding mortgages, but also that mortgages are the most significant source of debt among indebted older adults.
In conducting the study UI looked at housing debt, home equity, and total wealth, excluding reverse mortgages because the HRS doesn't ask respondents to report the amount of their reverse mortgage, only whether they have one. Income, assets, and debt are reported in 2015 dollars.
Homeownership rates have suffered badly since the beginning of the recession and by 2012 had declined 1.5 percent to 65.4 percent. However, for those age 65 and over the rate increased 1.9 percent over the same period to 80.7 percent although Census data shows that it has fallen slightly since then as the overall homeownership rate continued to decline.
The typical over-65, owner-occupied household saw its home equity increase 42 percent between 2000 and 2006 from $117,000 to $166,000, inflation-adjusted, then decline 22 percent through 2012 to $129,000. Although equity is larger today, the size of home equity relative to total wealth has not changed much over this period, ranging from 51.2 to 58 percent. To some extent, this trend can be explained by the increased prevalence of 401(k) plans and individual retirement accounts, which boosted household wealth.
While equity reflects the skyrocketing home values during the housing booms of the 1990s and early 2000s and their decline after 2006, it also reflects trends in housing debt. Nationally, outstanding mortgage debt increased from $2.5 to $11.3 trillion between 1990 and 2006 and then declined to $9.9 trillion in 2015.
UI found that between 1998 and 2012, the share of homeowners over age 65 with housing debt rose from 23.9 to 35 percent while their level of indebtedness nearly doubled from a median of $44,000 to $82,000. Most of these increases took place before the recession. Rising medical costs may have had a part in this debt increase, forcing older homeowners to draw on equity to pay medical bills or delaying pay down of debt, but the authors attribute the increase primarily to changing societal attitudes about debt and a false security driven by the rapid rise in home values in the early 2000s. The proliferation of innovative mortgage products, the streamlining of home equity and mortgage lending processes, and the aggressive actions of some lenders may have also played a role.
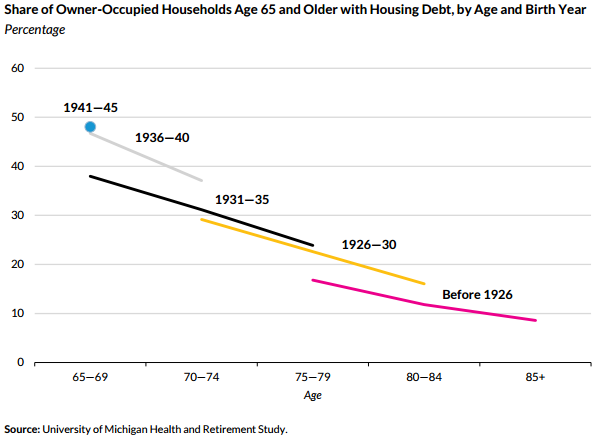
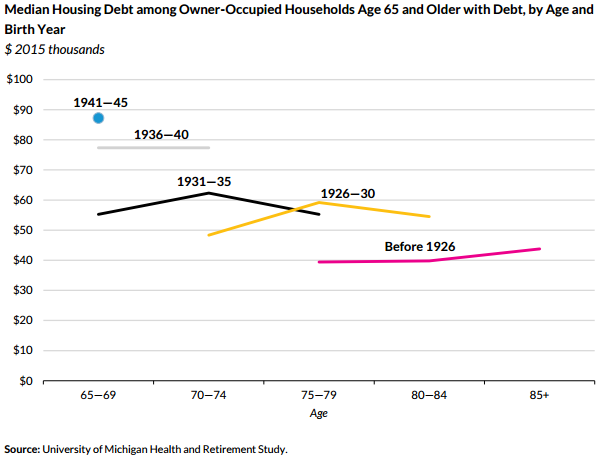
Recent cohorts of older homeowners are more indebted than earlier ones at the same ages. For example, of those born between 1941 and 1945, 48 percent had housing debt at ages 65 to 69, while the same applied to only 38 percent of those born from 1931 to 1935. The debt was higher too, a median of $87,000 for the first cohort, $55,000 for the second.
The authors say debt is not necessarily concerning, but it becomes riskier as the amount of debt increases relative to the home value. Trends in loan-to-value (LTV) ratios show that older households with housing debt are increasingly leveraged. The median LTV ratio was only 31.4 percent in 1998 but was 44.6 percent in 2012. The share of older homeowners with housing debt and with LTV ratios of at least 80 percent more than doubled from 8.4 percent in 1998 to 19.5 percent in 2012, with all the increase occurring after the Great Recession. The share who were underwater (mortgage balance greater then home value) nearly tripled during this period.
The trend toward higher LTV ratios came even as home values increased. It did not match the increase in housing debt however with median home values from 1998 to 2012 among indebted households up 31 percent while median debt rose 86 percent. Isolating the housing crisis years 2006 to 2012, values declined 19 percent but debt still rose 15 percent.
UI next looked at what older households are doing with this equity and what the implications for their retirement might be. We will summarize this in an upcoming article.


