
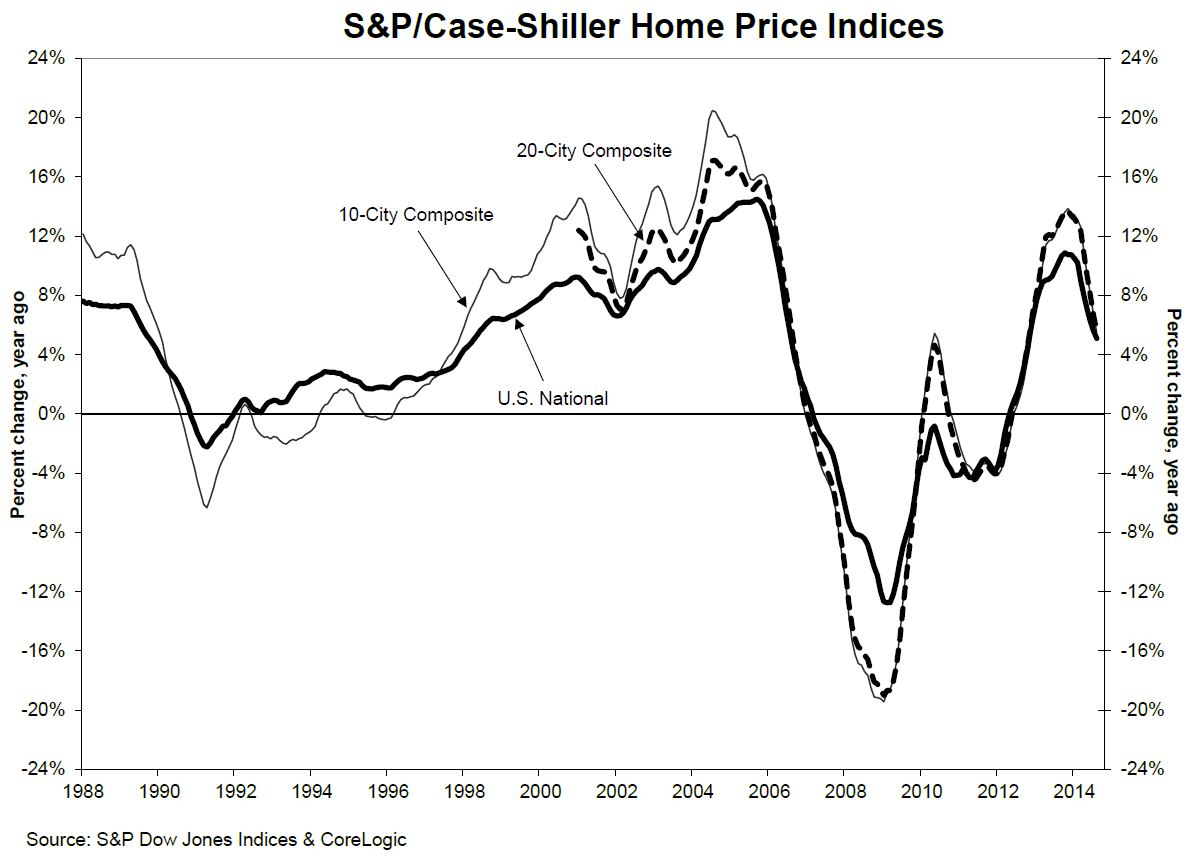
August data released this morning by S&P Dow Jones Indices reveals that, while home prices throughout the U.S. continue to increase, the rapid pace in those gains seen earlier continues to decelerate. The S&P/Case-Shiller National Index as well as both composite indices eked out 0.2 percent increases from July to August but all three slipped to lower year-over-year gains than they posted the previous month.
The 10-City Composite Index was up 5.5 percent compared to August 2013 and the 20-City gained 5.6 percent. Both composites had posted 6.7 percent increases from July 2013 to the same period in 2014. The National Index, which covers all nine U.S. Census divisions, had a 5.1 percent annual growth in August against 5.6 percent in July.
David M. Blitzer, Chairman of the Index Committee at S&P Dow Jones Indices said, "The Sun Belt region reported its worst annual returns since 2012, led by weakness in all three California cities -- Los Angeles, San Francisco and San Diego." He noted however that even as the year-over-year numbers weaken, home prices continue to increase overall and the National Index increased for the eighth consecutive month.
Those monthly increases were smaller in August than in July as well. The 2 percent increase in all three indices from July to August was one third the increase posted by each during the previous month.
Blitzer said that the large extent of slower increases is seen in the annual figures. All 20 cities also had lower annual numbers than the previous month. "Las Vegas continues to see a sharp deceleration in their annual home prices with a 10.1% annual return, down just below three percent from last month," Blitzer said. "Miami is now leading the cities with a 10.5% year-over-year return. San Francisco, which has shown double-digit annual gains since November 2012, posted an annual return of 9.0% in August.
"Despite softer price data, other housing data perked up. September figures for housing starts, permits and sales of existing homes were all up. New home sales and builders' confidence were weaker. Continued labor market gains, low interest rates and slower increases in home prices should support further improvements in housing," he said.
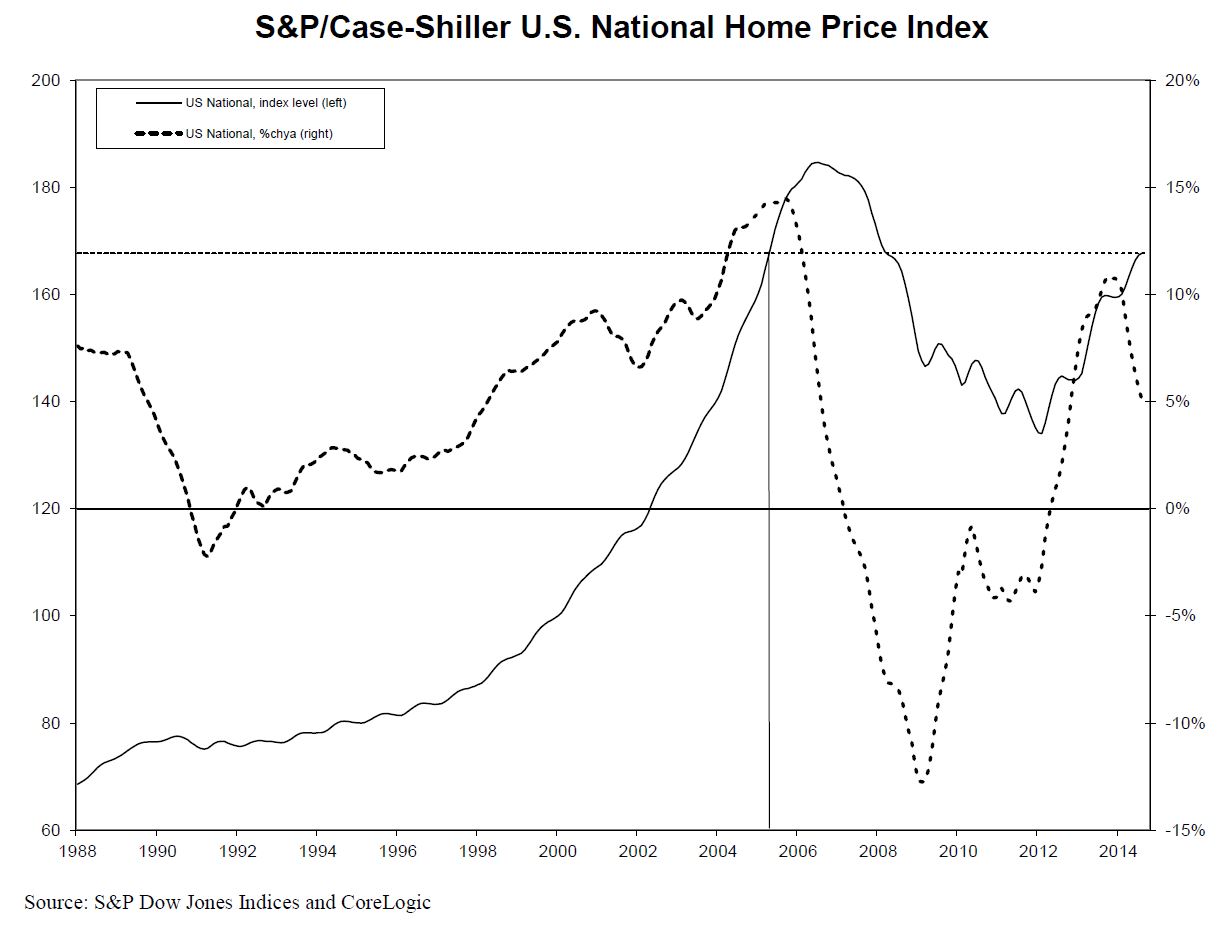
As of August average home prices across the U.S. are back to spring 2005 levels and prices for the metropolitan statistical areas within the 10-City and 20-City Composites have returned to those of autumn 2004. Both composites are now about 16 to 17 percent below their respective June/July 2006 peaks and have recovered from their March 2012 lows by 28.8 percent in the case of the 10-City Composite and 29.5 percent for the 20-City.
All cities except Boston and Detroit posted lower monthly returns in August compared to their returns reported for July. San Francisco showed its largest decline since February 2012; it was the only city that showed a negative monthly return two months in a row from -0.3% in July to -0.4% in August.
The S&P/Case-Shiller Home Price Indices are constructed to accurately track the price path of typical single-family homes located in each metropolitan area provided. Each index combines matched price pairs for thousands of individual houses from the available universe of arms-length sales data. The U.S. Home Price Index tracks the value of single-family housing within the United States and is a composite of single-family home price indices for the nine U.S. Census divisions. The indices have a base value of 100 in January 2000; thus, for example, a current index value of 150 translates to a 50% appreciation rate since January 2000 for a typical home located within the subject market.
As of August Detroit is the only city to remain below the 100 index value. It is currently at 99.05 despite a 7 percent annual increase in the index value.


