
The impact of low interest rates and pent up buyer demand played out in sharply increasing home prices in August. Both the Federal Housing Finance Agency (FHFA) and S&P CoreLogic Case-Shiller indices posted significant appreciation on an annual basis and acceleration in that appreciation compared to prior months.
CoreLogic Deputy Chief Economist Selma Hepp commented, "The forgone spring home-buying season appears to have fully shifted into summer months, leading to sales volumes that are picking up speed at a time when they would normally show signs of slowing. Additional demand was amplified by buyers looking for larger homes and second homes in resort and beach areas. Current home price growth is exceptionally strong given that the U.S. is an economic recession, but it is the historically low inventories and record-low mortgage rates that are outweighing economic and employment headwinds and fueling the price acceleration."
The S&P CoreLogic Case-Shiller U.S. National Home Price Index which covers all nine U.S. census divisions rose 5.7 percent year-over-year. The annual gain in July was 4.8 percent. The increase from July to August was 1.1 percent before adjustment and 1.0 percent afterward.
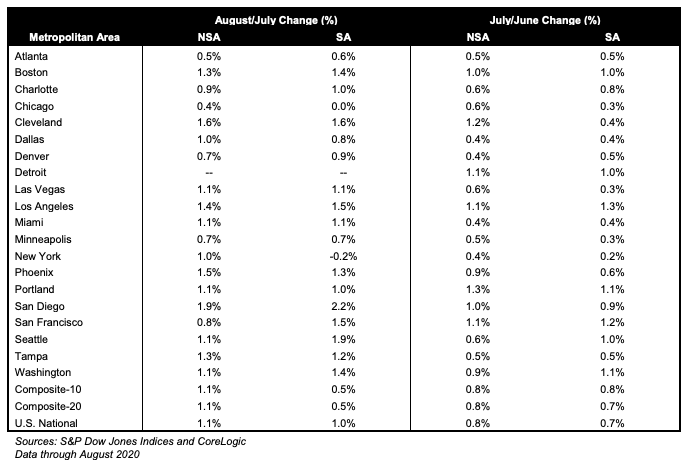
The 10-City Composite Index rose 4.7 percent on an annual basis, a 1.2 percentage point acceleration from July. The 20-City Composite gained 5.2 percent on an annual basis compared to 4.1 percent a month earlier. Both composites were up for the month by 1.1 percent unadjusted and 0.5 percent adjusted. Full information on Wayne County, Michigan, where Detroit it located, is still not available in a sufficient volume, due to earlier pandemic related closures, to include that city in the composite indices. Absent Detroit, all 19 cities reported increases in August before adjustment and 17 did so afterward.
Phoenix, Seattle, and San Diego reported the highest year-over-year gains among the 19 cities in August. Phoenix led for the 15th straight month, this time with a 9.9 percent annual increase. Seattle's home prices rose 8.5 percent followed by San Diego at 7.6 percent. All 19 cities reported higher price increases in the year ending August 2020 versus the year ending July 2020. Prices were strongest in the West and Southeast regions, and comparatively weak in the Midwest and Northeast."
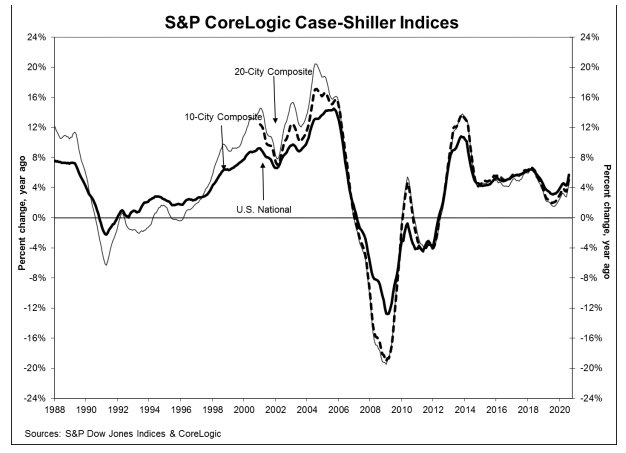
"Housing prices were strong in August," says Craig J. Lazzara, Managing Director and Global Head of Index Investment Strategy at S&P Dow Jones Indices. "The National Composite Index gained 5.7 percent relative to its level a year ago, well ahead of July's 4.8 percent increase. The 10- and 20-City Composites (up 4.7 percent and 5.2 percent, respectively) also rose at an accelerating pace in August. The strength of the housing market was consistent nationally - all 19 cities for which we have August data rose, and all 19 gained more in the 12 months ended in August than they had done in the 12 months ended in July.
"A trend of accelerating increases in the National Composite Index began in August 2019 but was interrupted in May and June, as COVID-related restrictions produced modestly-decelerating price gains. We speculated last month that the accelerating trend might have resumed, and August's results easily bear that interpretation. The last time that the National Composite matched August's 5.7 percent growth rate was 25 months ago, in July 2018. If future reports continue in this vein, we may soon be able to conclude that the COVID-related deceleration is behind us.
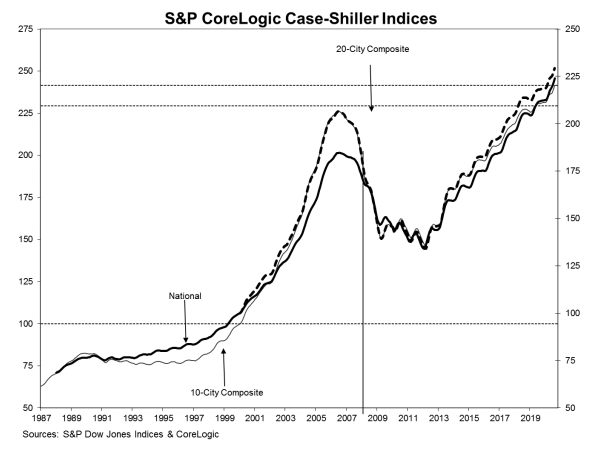
The S&P CoreLogic Case-Shiller Home Price Indices are constructed to accurately track the price path of typical single-family home pairs for thousands of individual houses from the available universe of arms-length sales data. The National U.S. Home Price Index tracks the value of single-family housing within the United States. The indices have a base value of 100 in January 2000; thus, for example, a current index value of 150 translates to a 50 percent appreciation rate since January 2000 for a typical home located within the subject market.
As of August 2020, the National Index was at 223.97 compared to 221.64 in July. The 10- and 20-City Composites had readings of 241.47 and 229.35. Los Angeles has the highest index reading at 305.27 and Cleveland (absent data on Detroit) the lowest at 136.52.
FHFA reported that its House Price Index (HPI) was up a stunning 8.0 percent from the prior August. On a monthly basis prices rose 1.5 percent and the agency revised its July increase from 1.0 to 1.1 percent.
For the nine census divisions, seasonally adjusted monthly house price changes from July 2020 to August 2020 ranged from an 0.9 percent gain in the South Central division to 1.9 percent in the West South Central division. The 12-month increases ranged from 7.2 percent in the West North Central division to 9.7 percent in the Mountain division.
"U.S. house prices posted a strong increase in August," said Dr. Lynn Fisher, FHFA's Deputy Director of the Division of Research and Statistics. "Between July and August 2020, national prices increased by 1.5 percent, which represents the largest one-month price increase observed since the start of the index in 1991. This large month-over-month gain contributes to an already strong increase in prices over the summer. These price gains can be attributed to the historically low interest rate environment, rebounding housing demand, and continued supply constraints."
The FHFA HPI is based on the purchase price of homes financed through loans purchased or acquired by the GSEs Fannie Mae and Freddie Mac. The index was benchmarked to 100 in January 1991. The August reading was 297.7.


