
Price gains since the recent low have increased faster and were less driven by inflation than prices during the housing boom of the last decade according to commentary in the S&P/Case Shiller Home Price Indices report. Home prices increased slightly more on an annual basis in August than they did in July on all three of the company's Home Price Indices (HPI). The U.S. National HPI, covering all nine U.S. census divisions had the smaller increase, gaining one additional percentage point while the two city composites each were up by two.
The National Index posted a +4.7 percent change in prices compared to August 2014 compared to a 4.6 percent annual gain in July. On a month-over-month basis that index increased by 0.3 percent before being seasonally adjusted and 0.4 percent after.
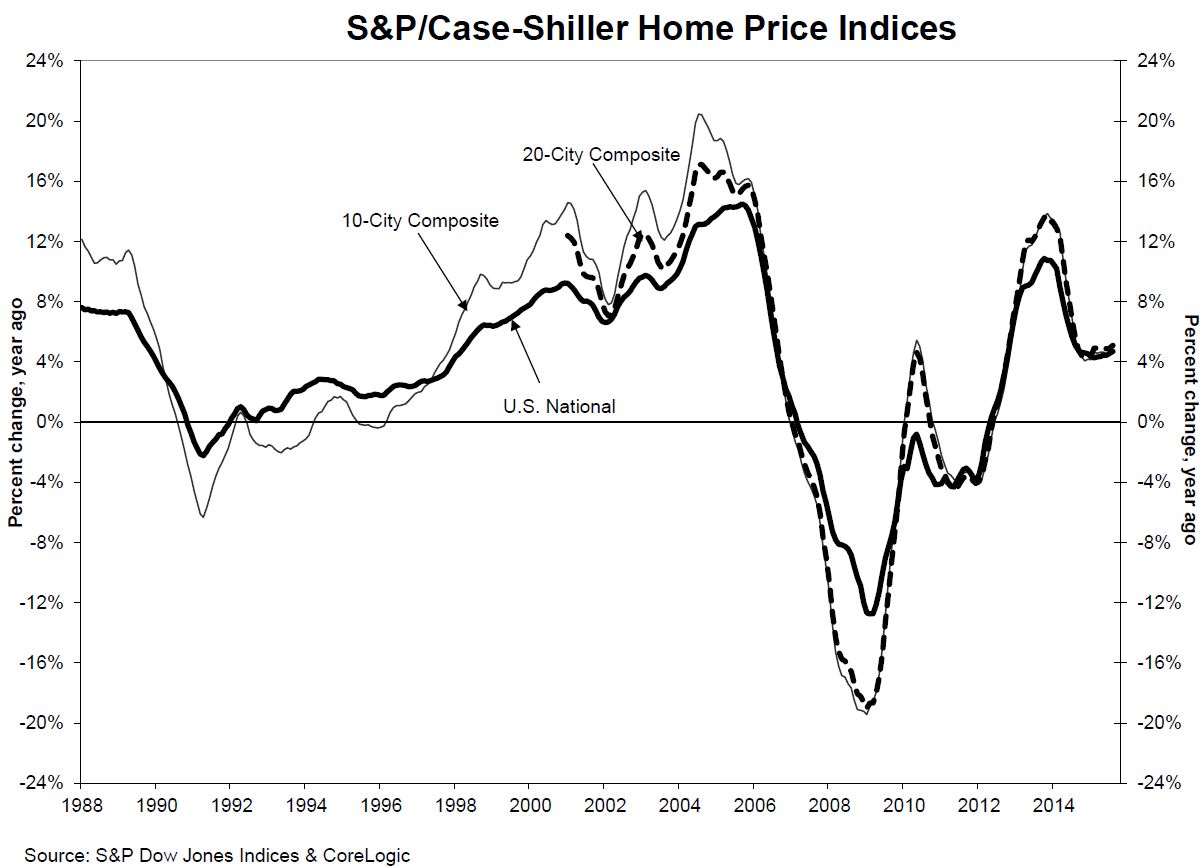
The 10-City Composite Index had risen 4.5 percent from July 2014 to July 2015. In August the HPI accelerated to a 4.7 percent gain. The 20-City Composite went from 4.9 percent to a 5.1 percent increase. On a non-seasonally adjusted basis the 10-City Composite was up 0.3 percent from July to August and the 20-City rose 0.4 percent. When seasonally adjusted each composite was up 0.1 percent. Eighteen of 20 cities reported increases in August before seasonal adjustment; after seasonal adjustment, five were down, 11 were up, and four were unchanged.
San Francisco and Denver are the only cities still posting double digit increases; each were up 10.7 percent from last August. Portland, Oregon had the third greatest gain at 9.4 percent. Fifteen cities increased their price gains compared to July and Phoenix, up 4.9 percent, had the longest steak among the cities, the ninth consecutive month with growing price gains. Portland posted a 9.4% annual increase, up from 8.5% in July 2015; this is the biggest jump in year-over-year gains this month.
David M. Blitzer, Managing Director and Chairman of Dow Jones' Index Committee said, "Home prices continue to climb at a 4% to 5% annual rate across the country. Most other recent housing indicators also show strength. Housing starts topped an annual rate of 1.2 million units in the latest report with continuing strength in both single family homes and apartments. The National Association of Home Builders sentiment survey, reflecting current strength, reached the highest level since 2005, before the housing collapse. Sales of existing homes are running about 5.5 million units annually with inventories of about five months of sales. However, September new home sales took an unexpected and sharp drop as low inventories were cited as a possible cause.
"A notable part of today's economy is the continuing low inflation rate; in the year to September, consumer prices were unchanged. Even excluding food and energy, the core inflation was 1.9%. One result is that a 5% price increase in the value of a house means more today than it did in 2005-2006, the peak of the housing boom when the inflation rate was higher. The rebound from the recent lows was faster than the 1997-2005 housing boom, and also much less driven by inflation.
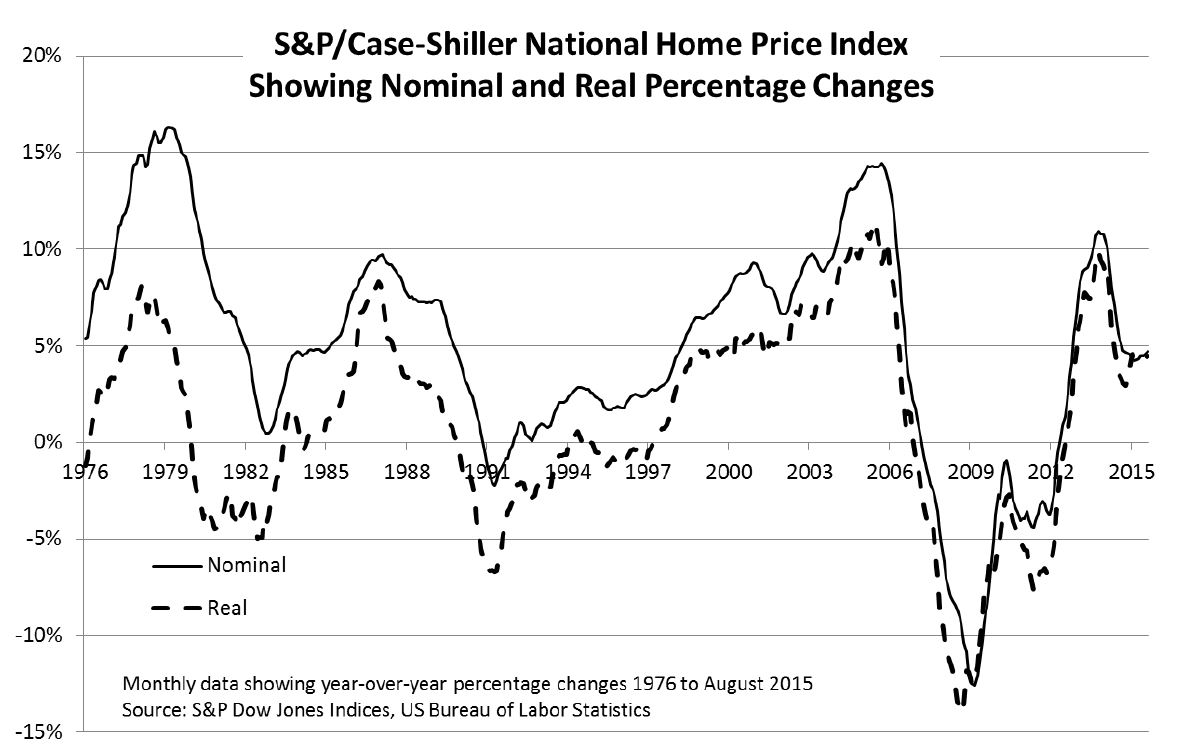
The above chart shows the monthly year-over-year percentage change in the nominal (current dollar) S&P/Case-Shiller National Home Price Index and in the inflation adjusted (real) national index. After removing the effect of inflation, prices rose almost as quickly in 2013 as they did in 2005-2006, the peak of the boom. The inflation adjustment is based on the consumer price index.
As of August home prices on both the 10 and 20 City Composites have recovered by 34.8 percent and 36.1 percent respectively from their March 2012 lows and are back to winter 2007 levels. The peak to current decline for both indices is approximately 11 to 13 percent.
The S&P/Case-Shiller Home Price Indices are constructed to accurately track the price path of typical single-family home pairs for thousands of individual houses from the available universe of arms-length sales data. The S&P/Case-Shiller National U.S. Home Price Index tracks the value of single-family housing within the United States. The indices have a base value of 100 in January 2000; thus, for example, a current index value of 150 translates to a 50% appreciation rate since January 2000 for a typical home located within the subject market.
The 10-City Composite currently has an index level of 197.37 and the 20-City a value of 182.47. The National Index is at 175.43. Detroit is the city with the lowest index at 103.96 and Los Angeles has the highest at 238.42.


