
The Federal Housing Finance Agency (FHFA) with the assistance of the two government sponsored enterprises (GSEs) for which it has oversight, has updated projections for the additional funds Freddie Mac and Fannie Mae will require from the U.S. Treasury. Since the GSEs were placed in conservatorship under FHFA in August 2008 Freddie Mac has drawn $65 billion and Fannie Mae $104 billion from Treasury under the terms of the Senior Preferred Stock Purchase Agreements (PSPAs) among the three parties. Under terms of that agreement the GSEs, while drawing funds from Treasury, also pay regular dividends. To date Freddie Mac has paid $13 billion and Fannie Mae $15 billion while, at the same time, drawing on additional support.
The new projections are more optimistic than those made one year ago which estimated cumulative Treasury draws (including dividends) at the end of 2013 would range from $221 billion to $363 billion. The new projections are for cumulative draws to range from $220 billion to $311 billion. The change can be attributed primarily to the fact that actual results for the first year of the earlier projection were substantially better than expected.
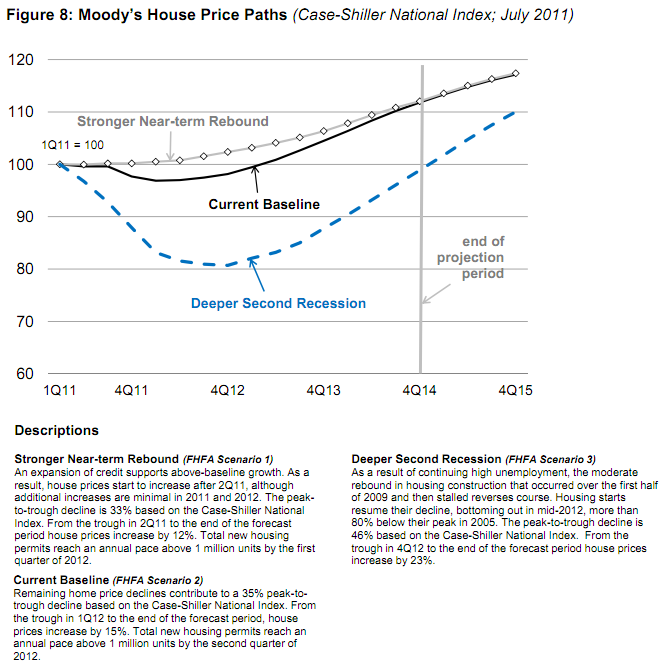
The range of projections is arrived at through the use of three different scenarios. These scenarios use identical assumptions except for the basis used for house prices. Experience has shown that changes in house prices have had the largest impact on the GSEs financial results. The three house price assumptions are:
- Scenario 1: Moody's "stronger Near-term Rebound" house price paths.
- Scenario 2: Moody's "Current Baseline" house price paths.
- Scenario 3: Moody's "Deeper Second Recession" house price paths.
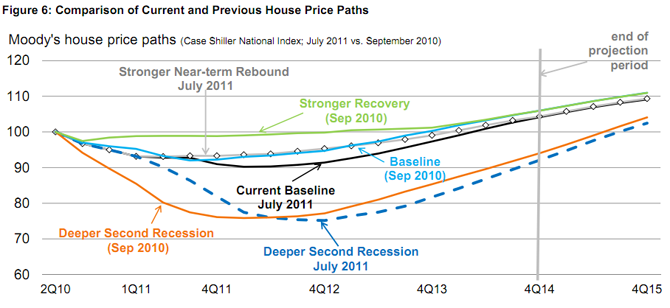
As can be seen from the chart, actual and forecasted house price paths for Scenarios 1 and 2 used in the current projections are worse than those used last year. The path in Scenario 3 in October 2011 is better through the second quarter of 2012 than the corresponding paths used one year ago and then worse thereafter.
The remaining assumptions, used in all three scenarios are:
- Future interest rates are implied by the forward curves as of June 30, 2011
- ABS and CMBS prices fall by 5 points at the beginning of the period;
- Agency MBS spreads to swaps remain unchanged
- Zero growth in credit guarantees through year end 2014
- Additions to retained portfolios are limited to nonperforming loans bought out of pools backing Fannie Mae's MBS and Freddie Mac's PCs.
There are only small changes in the cumulative financial results for either GSE under Scenarios 1 and 2, but substantial differences in the bottom line projections under Scenario 3, the scenario using the "Deeper Recession" price path. The differences, however, are almost totally attributable to increased provision for credit losses and other credit related expenses. Freddie Mac's credit-related expenses increase $23 billion from Scenario 1 to Scenario 3 and Fannie Mae's increase $57 billion. Thus, $80 billion of the projected $92 billion difference in Treasury draws across the scenarios is directly related to credit-related expense projections.
Here are the projected draws including dividends for Freddie Mac and Fannie Mae using each of the three scenarios:
|
GSE |
Draw through 6/30/11 |
Scenario 1 |
Scenario 2 |
Scenario 3 |
|
Fannie Mae |
104 |
86 |
93 |
176 |
|
Freddie Mac |
65 |
36 |
37 |
57 |
|
Total |
$169 |
$122 |
130 |
233 |
All figures in $billions
However, when the dividends required of the GSEs are broken out of the various scenarios, the financial situation they face becomes much less severe; in fact, in Scenarios 1 and 2 dividend payments to Treasury exceed additional Treasury draws. Under the PSPA, preferred stock accrues dividends at 10 percent per year. FHFA has periodically asked that the dividend requirement be dropped which would substantially reduce the need for Treasury funds and could improve the public perception of the GSEs.
|
GSE |
Draw through 6/30/11 |
Scenario 1 |
Scenario 2 |
Scenario 3 |
||||
|
Div. |
Draw-Div |
Div. |
Draw-Div. |
Div. |
Draw-Div. |
Div. |
Draw-Div. |
|
|
Fannie Mae |
15 |
89 |
45 |
41 |
46 |
47 |
115 |
61 |
|
Freddie Mac |
13 |
52 |
26 |
10 |
26 |
11 |
30 |
27 |
|
Total |
$28 |
$141 |
$71 |
$51 |
$73 |
$57 |
$91 |
$142 |
When the current projections are compared with those from October 2010, the following differences were noted.
- Both projections cover a period of 3.5 years thus the current one runs to the end of 2014; the earlier one to December 31. 2013. This extension adds $3 billion and $6 billion to current projections for Scenarios 1 and 3 respectively.
- Actual results for the first year were better than expected with a combined Treasury draw $19 billion lower for Scenario 1 and $73 billion lower for Scenario 3 than the projections.
- However, updated projections for the remainder of the initial projection were $14 billion higher for Scenario 1 and $16 billion higher for Scenario 2.
The differences in the projection pattern of financial results were driven by:
- A better than expected performance by borrowers with high TMT LTV loans and modified loans.
- Foreclosure delays that pushed some defaults into later years of the projection period.
- Trends indicating better than expected REO sales prices.
- Net interest income that is higher in the current projection because of lower interest rates resulting in decreased funding costs and slightly higher average portfolio balances.
- The previously mentioned diversion of the Scenario 3 house price path.
FHFA stresses that the projections reported in their current document are not expected outcomes but modeled projections in response to "what if" exercises based on assumptions about GSE operations, loan performance, house prices, and other factors. They do not define the full range of possible outcomes.


