
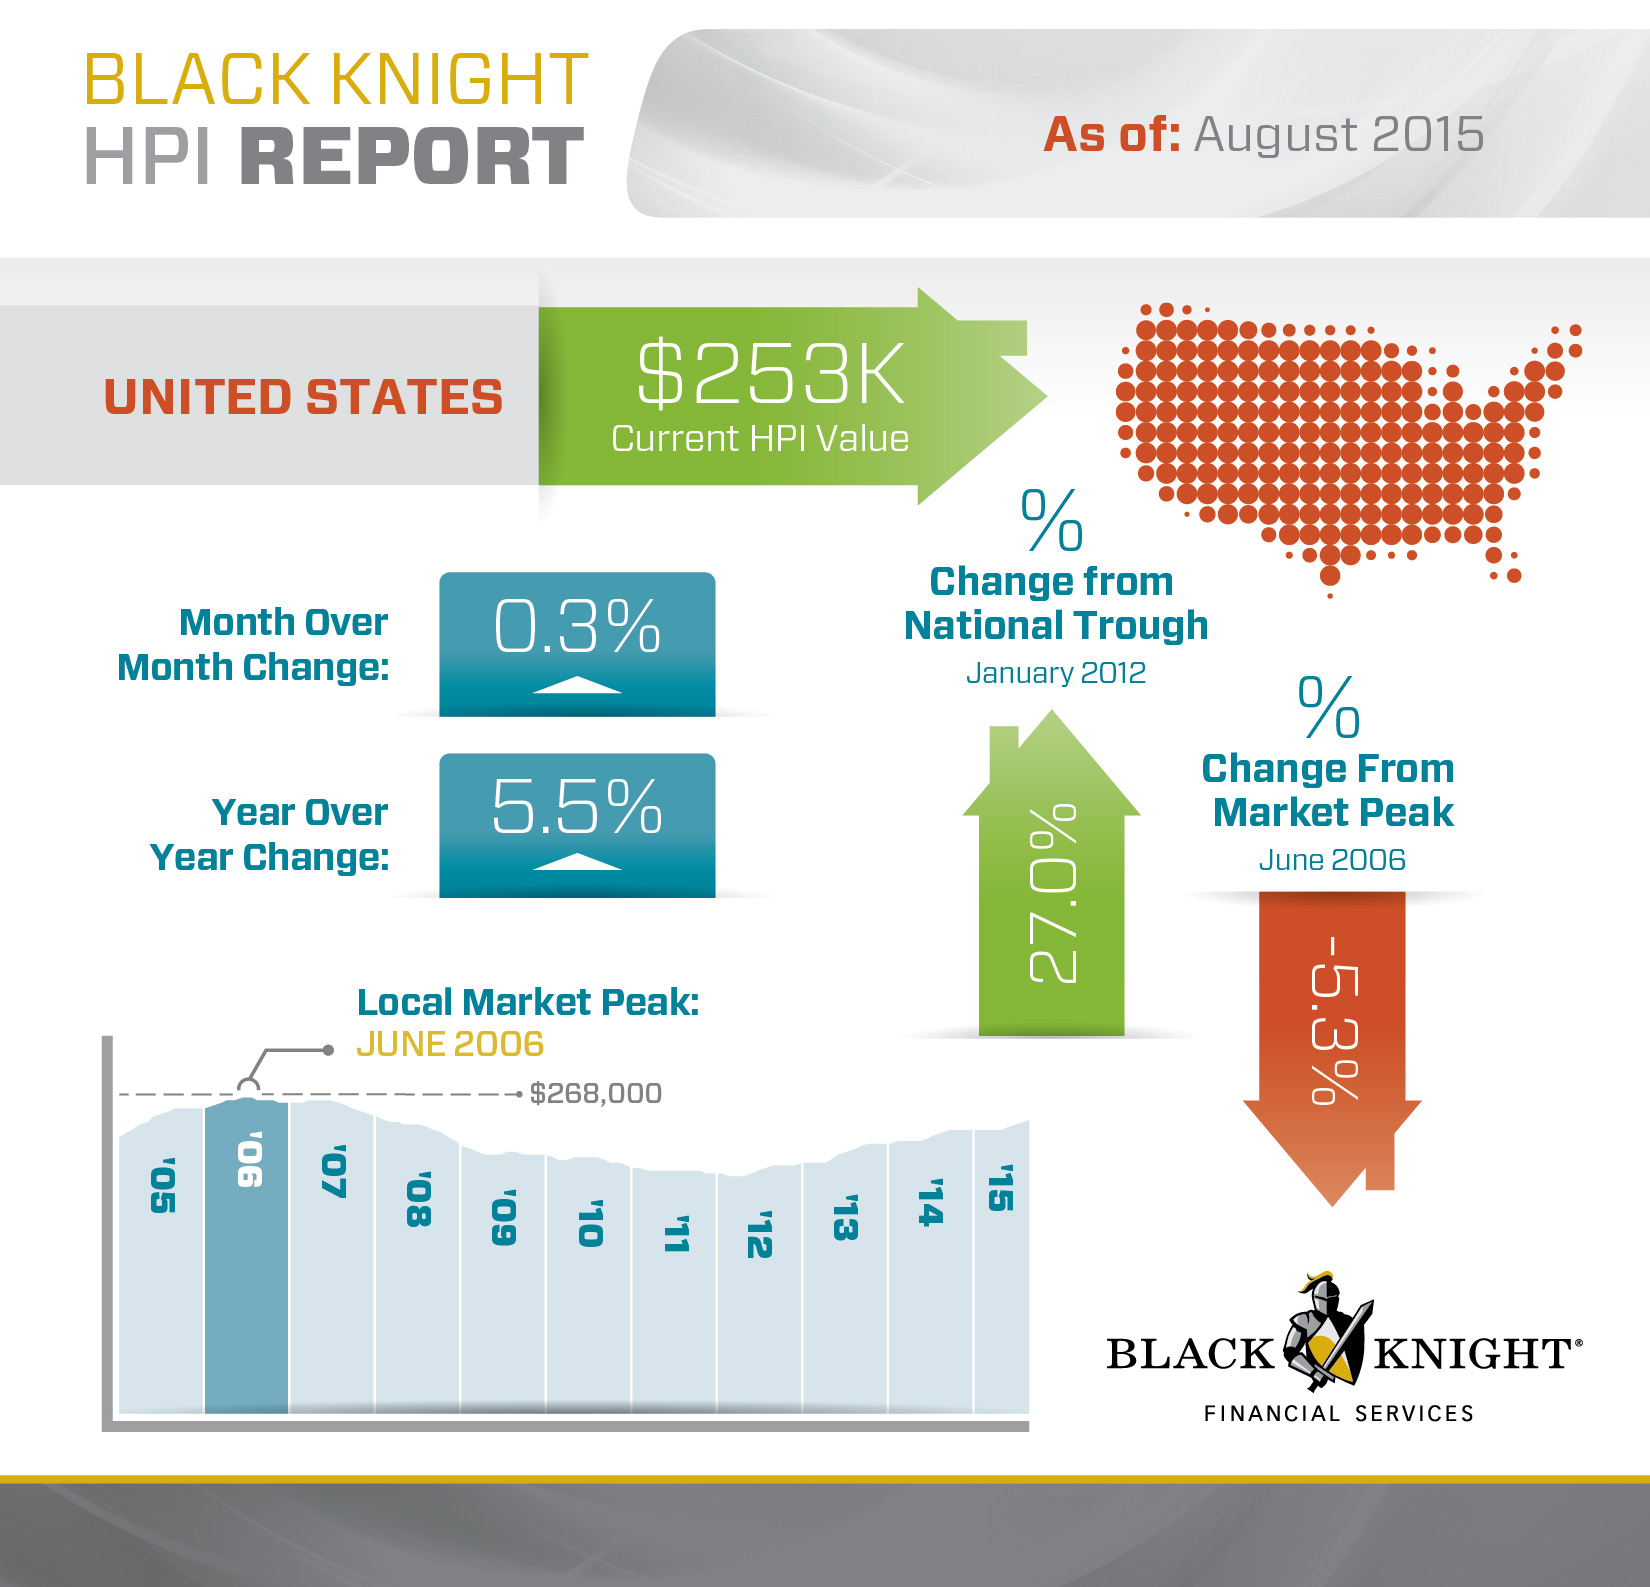
Home prices have now increased 27 percent since hitting bottom in January 2012. Black Knight Financial Services said today that prices nationally eked out a 0.3 percent increase in August compared to July and are up 5.5 percent from a year earlier. The national HPI now stands at $253000, only 5.3 percent off of the peak it reached in June 2006 of $268,000.
New York posted the largest monthly increase among the states, 1.8 percent, to an HPI of $358,000. The percentage increase in New York was more than double its nearest competitors New Hampshire and Texas, both of which were up 0.7 percent. The Empire State also posted an annual increase of 7.1 percent and accounts for all of the top ten increases among the nation's metropolitan areas, with Utica, Glens Falls and Watertown, NY all seeing 1.9 percent appreciation while New York City was up 1.3 percent.
Illinois had the poorest performance, dropping .5 percent for the month to an HPI of $218,000. Prices there are up 2.2 percent for the year. Seven of the ten metropolitan areas with the largest declines are in the state; Chicago was down 0.4 percent while Decatur, Peoria, Kankakee and Springfield all fell by 0.9 percent from July. Eight other states also posted negative numbers, Virginia, Rhode Island, Missouri, Connecticut, Indiana, Minnesota, Ohio, Iowa, Georgia
Home prices in New York, Tennessee and Texas all hit new peaks again in August as did nine of the nation's 40 largest metros, Austin, Boston, Dallas, Denver, Houston, Nashville, TN; Portland, Oregon; San Antonio, and San Francisco. Las Vegas, NV while up 62 from the market's bottom, is still more than 37 percent off its May 2006 pre-crisis peak, the most of any of the 40 largest metros.
Notably missing from the Black Knight report was California - where prices had been rising rapidly. The HPI for the state increased by 0.1 percent for the month and while, as noted San Francisco moved up to set another new price peak the HPI in Los Angeles was down 0.2 percent.
Black Knight/s HPI is based on a repeat sales analysis of home prices as of their transaction dates for more than 18,000 ZIP codes. The price of non-distressed sales is represented by taking into account discounted prices for REO and short sales.


