It has been a rather dismal spring and summer for construction, one in which permitting has declined in three out of the last four months. Going more granular, however, a report from the National Association of Home Builders (NAHB) finds that residential permitting, and thus construction, is picking up steam in many states.
The Census Bureau releases two separate reports covering aspects of residential construction each month. The one MND readers are most familiar with is the Residential Construction Report which provides details on the issuing of building permits, housing starts, and unit completions. It is based on the Survey of Construction and is partially funded by the Department of Housing and Urban Development. The second report focuses primarily on permits and presents data from the Building Permits Survey (BPS). The methodology behind the two surveys differs and so does the level of reporting. The Residential Construction Report presents data on a nationwide basis and for each of the four regions; the results of the BPS are available at state and local levels.
Danushka Nanayakkara-Skillington, in a post in the NAHB's Eye on Housing blog, digs down into that state level BPS data and finds that that most states are showing strength on a year-over-year basis. Unfortunately, her analysis is ragged as she inexplicably shifts the basis of the discussion between year-over-year and year-to-date.
First, she looked at year-to-date data (through August) for both 2016 and 2017, and found both the BPS and the SOC reporting roughly similar numbers on a nationwide basis. The SOC counted 875,500 permits year-to-date, up 7.5 percent from the same period in 2016; the BPS number was 852,825, a 7.7 percent increase.
Switching to year-over-year numbers, she reports that between August 2016 and August 2017, 37 states and the District of Columbia saw growth in the total number of permits issued. In twenty-two states and the District of Columbia that growth exceeded 7.7 percent while 13 states had a decline in growth. Montana topped the list at 31.9 percent while Maryland only grew by 0.7 percent. The 13 states that lost ground were led by Connecticut with a 20.5 percent decrease.
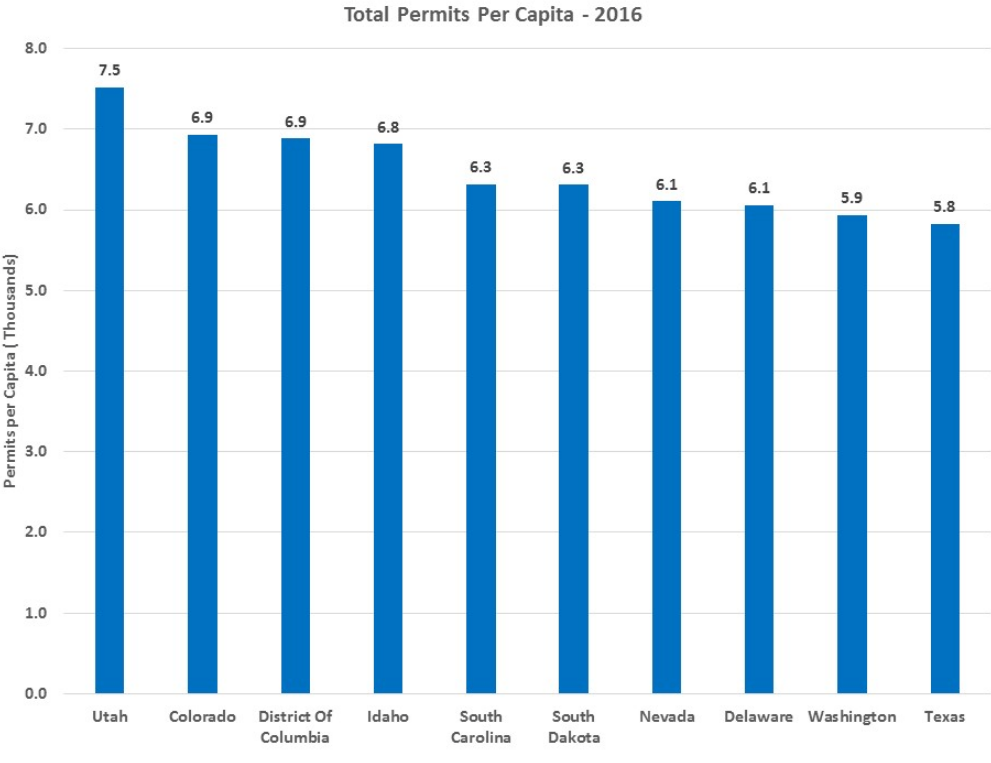
Ten states accounted for nearly 55 percent of all permits issued; Texas, Florida, California, North Carolina, Georgia, Washington, Colorado, Tennessee, New York, and Arizona. However, when the size of the state was muted by reporting permits on a per capita basis, the picture shifts.
Over the eight months ending in August 2017, the total number of single-family permits issued nationwide according to the BPS reached 561,938. This is 10.1 percent ahead of its level over the first eight months of 2016 with 510,590 permits. The results from the SOC are similar, single-family permits over the first eight months of 2017 numbered 564,000, up 10.7 percent from the 509,600 issued over the same period in 2016.
At the state level, the author found 43 states and the District of Columbia with growth in single-family permitting between August 2016 to August 2017. Similar to total permits, 22 states recorded a growth above 10.1% but seven states had a decline in growth. Hawaii had the highest growth rate during this time at 28.2% while North Dakota declined by 8.3%.
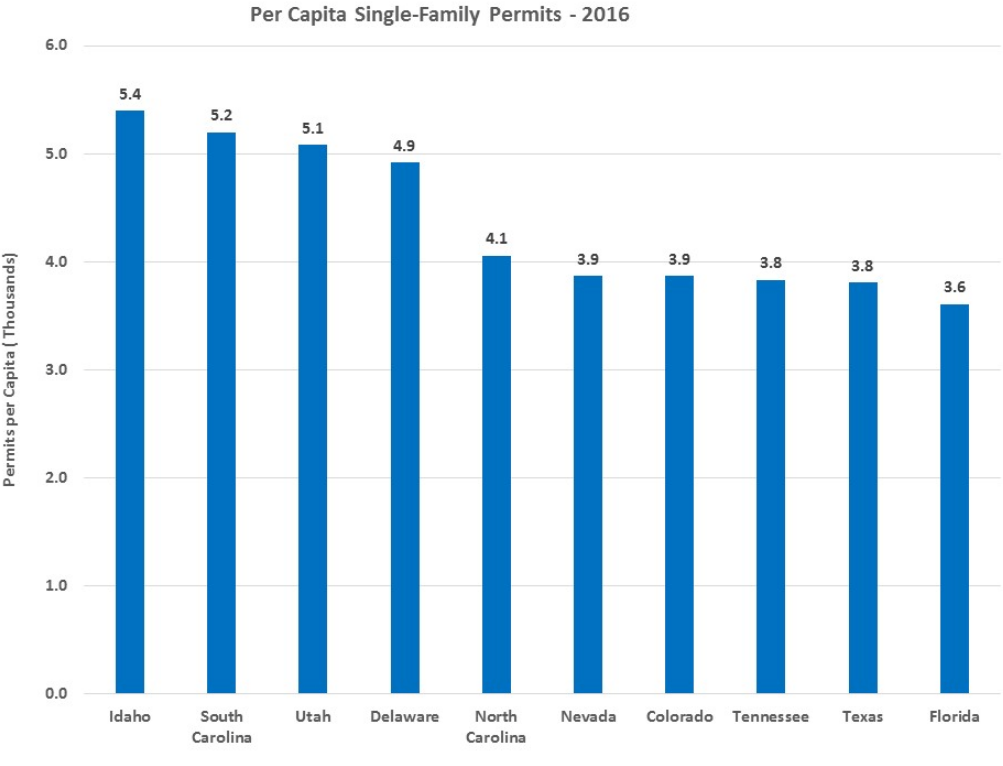
In the single-family sector, Texas led with 79,236 permits issued year-to-date in August 2017, while the lowest number came from the District of Columbia with 251 permits. Nine of the top ten permitting states also led in single-family permits, with South Carolina taking Washington's place. Adjusted for population, the leading states again shift.
According to the BPS where were 290,998 multi-family permits issued nationwide through August 2017 compared to 280,923 during the same period in 2016, an increase of 3.5 percent. The SOC reports 293,000 multi-family permits over the eight-month period, 2.0 percent more than the 287,900 issued in 2016.
Between August 2016 to August 2017, 26 states and the District of Columbia increased this permitting while 25 states recorded a decline. Twenty-four states and the District of Columbia recorded a growth above 3.5% with Mississippi leading the way with a growth of 185%, from 327 to 932, while Rhode Island had the largest decline of 71.7%.
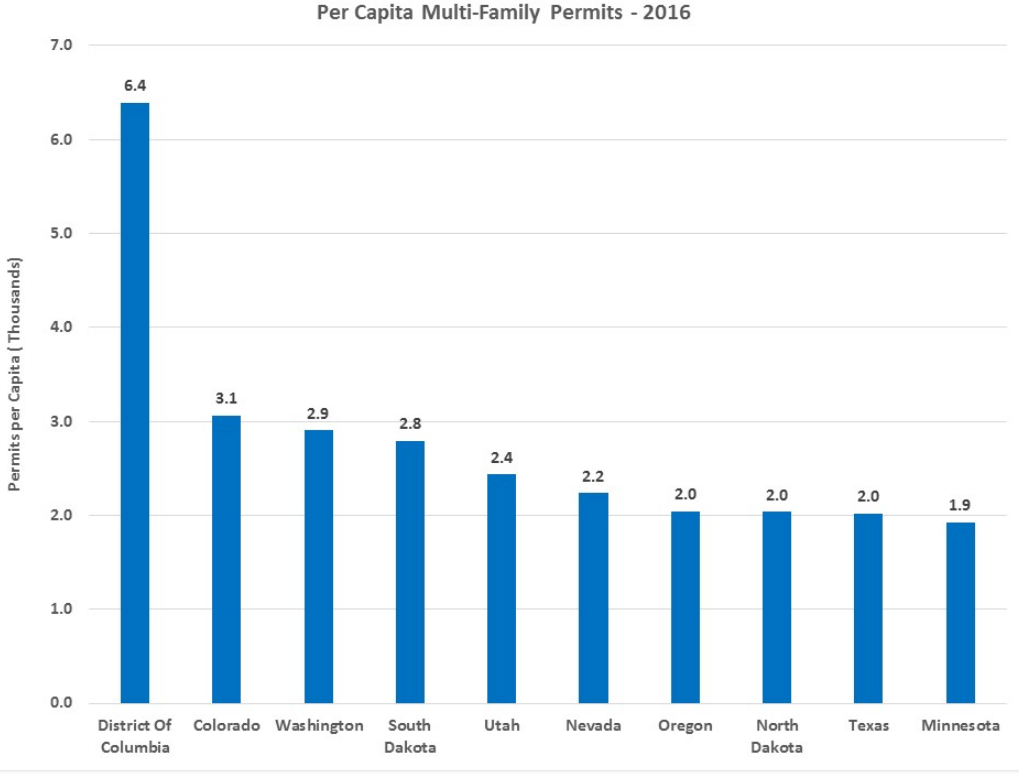
While Texas issued the most multi-family permits year-to-date, they are ninth on a per-capita basis, dwarfed by the District of Columbia which had twice the activity of second-place Colorado. Despite its dramatic increase, Mississippi still only issued 0.2 permits per thousand people.