The housing industry has long expected that pending home sales in a given month will fairly accurately forecast the actual sales transactions that follow one or two months later. But Bin He - principal economist with the CoreLogic Decision Analytics & Research Team (DART), thinks we may be overlooking some other predictive abilities of the pending sales data.
A sales becomes pending when an offer to purchase is accepted and a contract is signed. The most common data on pending sales is a monthly report published by the National Association of Realtors® but He used data from CoreLogic Listing Trends and his analysis indicates that pending home sales might also offer a preview into the future of home prices, at least those measured by CoreLogic's HPI. His results appear in the CoreLogic Insights blog.
Not all pending sales result in an actual sale; sellers have second thoughts, buyers fail to get a mortgage, problems with home inspections scuttle the deal. Still, He says, the information contained in pending sales provides a good indication of the sale activities and house price trends over several months' time.
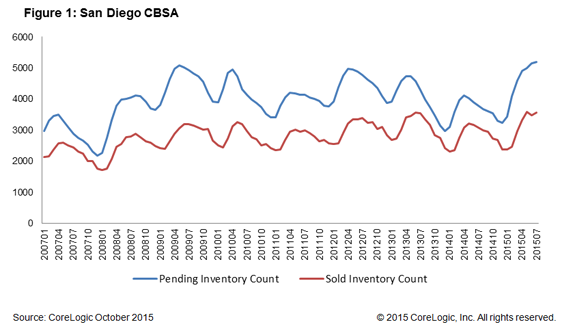
Figure 1 looks at pending sales in the San Diego Core Based Statistical Area (CBSA) as an example. It shows the inventory of pending sales and the sold listings. These track each other very well and close observation will note that, as should be expected, the pending inventory seems always to peak one month earlier than the sold inventory.
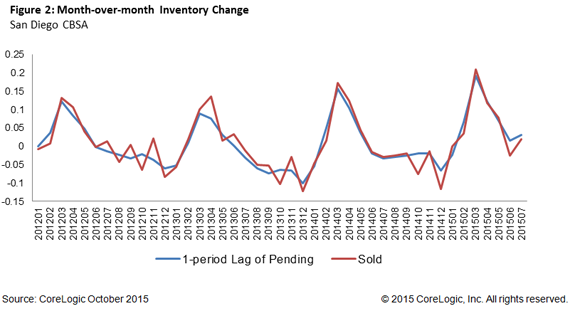
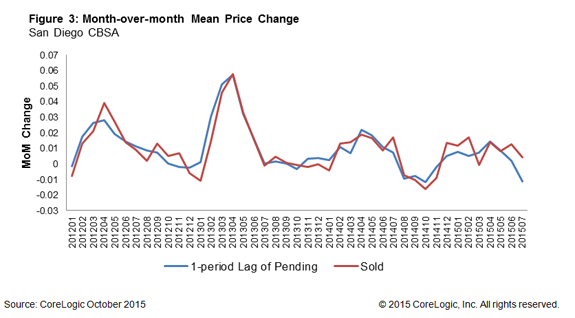
In Figure 2 we can see the month-over-month change for the sold inventory and the one-period lag for pending sales for the last three years. The two, He says, are almost on top of each other. In Figure 3, that one-period lag of average pending price change month-over-month is also the same as the mean sold month-to-month price change.
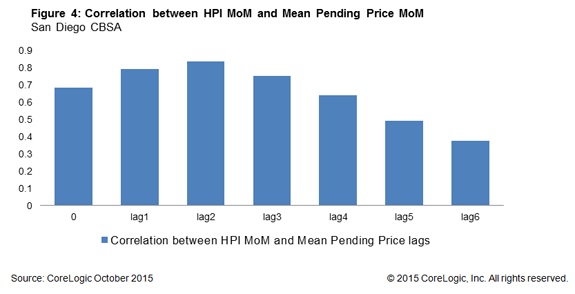
He then turned to CoreLogic's HPI, assuming that since the mean pending price leads the mean sale price that information can be projected forward into the future HPI although he acknowledges that it is not a totally accurate comparison - one is a mean price while the HPI is a repeat sales index. Figure 4 shows the correlation between the month-over-month HPI and the lags of month-over-month mean pending or contract price. Lags 1 and 2 of the pending price shows the highest correlation with the HPI meaning that the mean pending price "can provide good insight on the movement of the HPI several months before it is even published."