
With the exception of 2000, a greater percentage of Americans own homes today than at any time since the U.S. Census Bureau began to collect homeownership data. The current homeownership rate in the country is now 65.1 percent, a loss of 1.1 percentage points between 2000 and 2010. This is the largest drop in the rate since the period from 1930 to 1940 when, one might say, there were similar economic factors in play.
Total housing units grew to 131.7 million, an increase of 15.8 million or 13.6 percent over the period between the 2000 and 2010 census. The supply of housing grew more quickly in the South where it increased 17.9 percent to 50 million units and the West which grew 17.3 percent to 28.6 million. The Midwest now has 29.5 million housing units, an increase of 9.3 million while the Northeast grew by 6.6 percent to 23.6 million.
The states with the greatest growth in housing inventory were Nevada (41.9 percent), Arizona (29.9 percent), Utah (27.5 percent,) Idaho (26.5 percent) and Georgia (24.6 percent.). West Virginia had the least growth at 4.4 percent.
Among regions, homeownership was highest in the Midwest (69.2 percent) and the South (66.7 percent). The Northeast and the West were considerably lower with rates of 62.2 percent and 60.5 percent respectively. Every region recorded some loss in homeownership over the ten year period.
States with the highest levels of homeownership were West Virginia (73.4 percent) and Minnesota (73.0 percent). New York had the lowest percentage of homeowners, 53.3 percent.
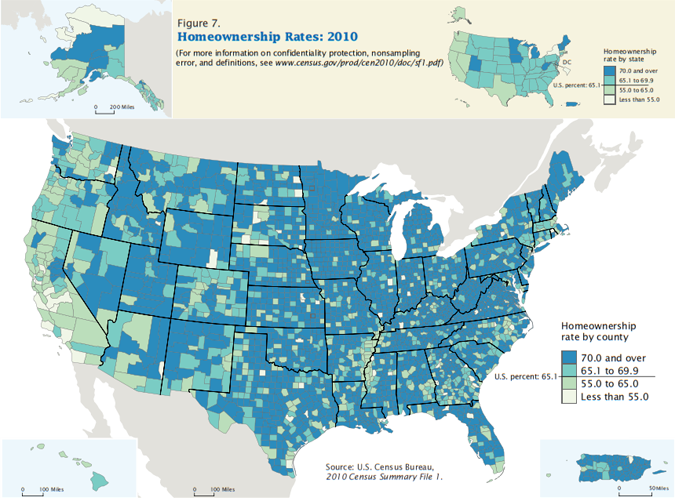
The only metropolitan area where renters outnumbered homeowners was Manhattan Kansas with a homeownership rate of 49.5 percent. By comparison, in 2000 renters outnumbered homeowners in five metropolitan areas. Similarly, homeowners were in the majority in most of the nations counties. Renters outnumbered homeowners in only 1.5 percent of the 3,143 counties (or their equivalents).
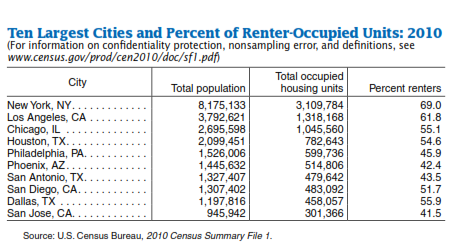
When the focus narrows from metropolitan areas to cities
the ratio of homeowners to renters shifts.
Renters made up 69 percent of households in New York City, 61.8 percent
in Los Angeles, 55.1 percent in Chicago, and 54.6 percent in Houston. Many counties, however, have seen an increase
in renter occupancy over the last ten years, some in the double digits. Only 14 counties saw more than a 5 percent
increase in homeownership.
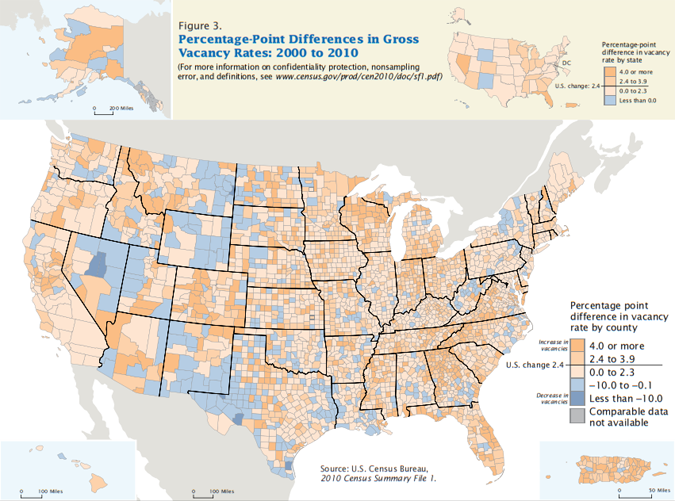
Nationally there were 15 million vacant housing units in 2010, an increase of 43.8 percent since 2000. This represents 11.4 percent of the total housing inventory. The vacancy rate was highest is the South at 12.7 percent; the other regions were all below the national rate. Only three states, New Mexico, Wyoming, and Hawaii, had a decrease in their gross vacancy rates and all those changes were less than one percentage point. Nevada had the largest increase in vacancies.
Homeowner vacancy rates (homes that are vacant and for sale) increased almost everywhere and rose nationally by 0.7 percent to 2.4 percent. The rental vacancy rate increased 2.3 percent to 9.2 percent.


