
In the first part of a series of article Market Pulse CoreLogic Principal Economist Mark Liu looked at the possibility that a new housing "bubble" was forming as home prices continue to rise. Liu identified 31 US Core Based Statistical Areas (CBSAs) as overvalued based on the company's Market Conditions Indicator measuring whether home price increases appear to be outstripping wage increases. He then winnowed out 10 cities where overvaluation was not supported by a too-large home price-to-rent ratio. Figure 1 shows those remaining areas that survived his initial analysis.
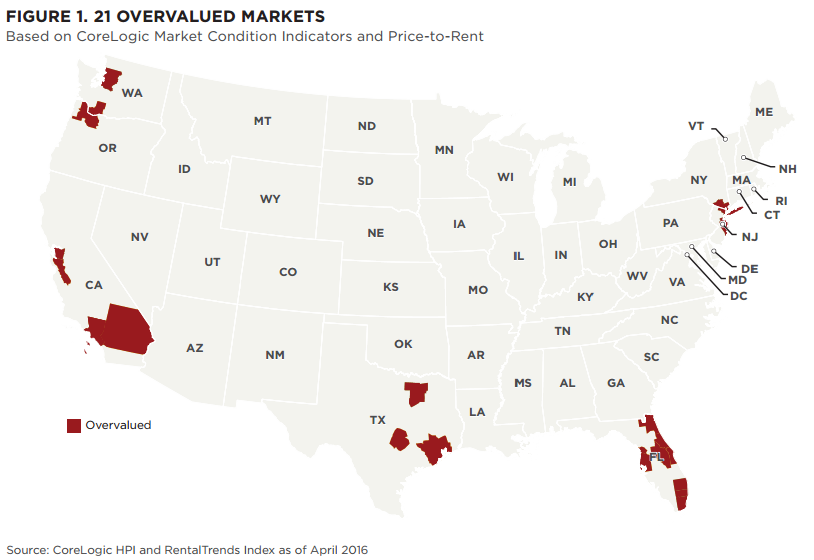
Liu said that the 21 remaining markets support one part of economist Joseph Stiglitz's definition of a bubble - that fundamental factors do not justify the price. In the second part of his analysis he tests the 21 remaining CBSAs against the rest of the definition, that prices are high today only because investors believe they will be high tomorrow. He does this using two other metrics which he calls the Flipping and the Fraud indices.
A housing bubble can start with a legitimate increase in housing demand, but at some point speculation usually comes into play and some people seek to make quick profits through short-term buying and selling. If enough people enter the market for that reason, then the bubble becomes self-fulfilling. Thus one clue to a bubble is an elevated level of flipping which can represent short-term buying and selling.
CoreLogic's Flipping Index tracks this type of buying and selling as a percentage of total sales in local markets. Short-term is defined as a purchase and subsequent resale of a property within a nine-month period. Figure 2 shows that the national flipping percentage reached an all-time high nationally at 6.5 percent during the 2005-2006 bubble and fell to 3 percent during the Great Recession. It is now hovering around 4 percent.
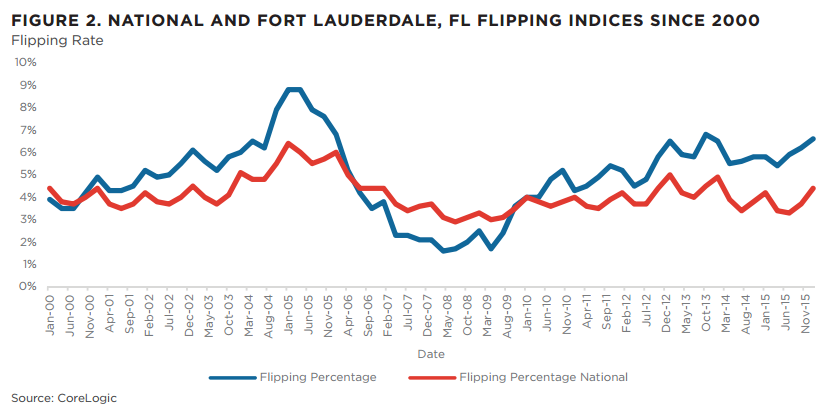
Using Fort Lauderdale again as an example Liu shows that its Flipping Index started out closely aligned with the national number in 2000, but then rose quickly with the Florida housing boom, and hit 9 percent during the bubble, dropping to 2 percent after the crash. It is now at 6.5 percent, more than 2 percentage points above the national average.
When the Flipping Index percentages are identified for the to the remaining CBSAs, Liu says 16 of them appear to be overvalued, eliminating Seattle, Portland, and New York. All of those that remain are in Texas, California, and Florida.
Finally, Liu says another thing we know about housing bubbles is that they are accompanied by widespread mortgage fraud; typically misrepresentation of income, employment, and occupancy. So is there any evidence that fraud is increasing among the remaining 16 overvalued areas?
CoreLogic's Mortgage Application Fraud Risk Index has tracked risk since 2010. That index shows that the areas in Texas all have values below the national level while the other 13 markets are all above the national level. These markets are all in California (San Jose, Oakland, Los Angeles, and Riverside) and Florida (Miami, West Palm Beach, Fort Lauderdale, Palm Bay, Daytona Beach, Orlando, Jacksonville, and Tampa*.) In most of these CBSAs home prices have grown twice as fast as rents and many have fraud and flipping rankings in the top quartile, indicating significant bubble risks.
So after using four metrics to evaluate home prices Liu concludes that only those 13 markets out of the 100 he looked at meet Stiglitz's second criteria for a bubble; that people have to believe there is no downside to a rising market.
*While Liu repeatedly refers to the 13 CBSAs found to be overvalued, he provides the names of only 12.


