
In the last four years housing prices, according to CoreLogic's Home Price Index (HPI) have risen 40 percent. So, are we heading toward a repeat of the 2005-2006 housing bubble? In a two-part analysis in the current issue of CoreLogic's MarketPulse, Mark Liu, principal economist, offers some reassurance.
First he defines just what a bubble is, using the
words of Nobel Laureate Economist Joseph Stiglitz. " f the reason that price is high today is
only because investors believe that the selling price is high tomorrow - when
'fundamental' factors do not seem to justify such a price - then a bubble
exists." Under that definition Lieu
says, the high price growth rate alone is not evidence of a housing bubble.
f the reason that price is high today is
only because investors believe that the selling price is high tomorrow - when
'fundamental' factors do not seem to justify such a price - then a bubble
exists." Under that definition Lieu
says, the high price growth rate alone is not evidence of a housing bubble.
Instead one must identify fundamental factors in housing markets and see whether the price growth rates can be justified by these factors and then identify metrics to capture the belief that the selling price will be high tomorrow.
Liu puts two metrics for measuring the fundamental factors; price to income and price to rent, and two for capturing Stiglitz's speculative belief. He calls those the Flipping Index and the Fraud Index.
In the price-to-income view of housing economics there is a stable relationship in the long run between house price and income. CoreLogic's Market Condition Indicators show that the long-run sustainable HPI is derived from the historic relationship between home prices and disposable income per capita coupled with the principle that home prices cannot outpace growth in household income forever. Over shorter periods home prices can exceed or fall below the long-run trend but not over a longer time because housing becomes unaffordable. At that point demand decreases causing home price growth to either slow or decline and realign with income levels in each market.
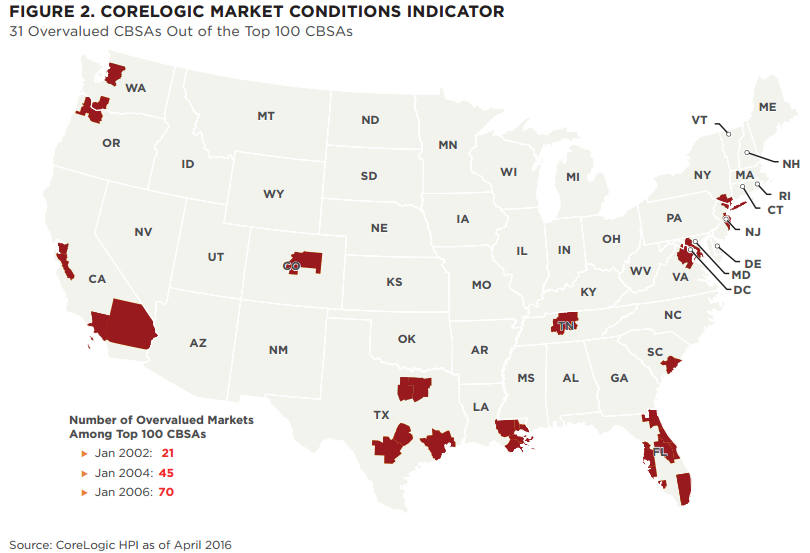
CoreLogic calculates the gap between actual HPIs and their long-run sustainable levels and defines an overvalued market as one in which the home price is more than 10 percent above its long-run sustainable level. Using this metric Liu identifies 31 markets among the top 100 Core Based Statistical Areas (CBSAs) that are overvalued. These include Seattle, Portland, and areas in California, Texas, and especially Florida. He puts that number in perspective with historical similarities; there were 21 overvalued CBSAs in 2002, 45 at the beginning of 2004, and 70 in January 2006. Therefore, if the country is indeed heading toward another bubble, which he doubts, it is currently at a stage equivalent to 2003.
Another way to evaluate the market is the price-to-rent view. Over the long run market forces should equalize the cost and benefits of owning vs renting if sufficiently liquid markets exist for each. Single family rental units became widespread only after institutional investors started buying them during the foreclosure crisis. Thus CoreLogic has been tracking average and median rentals for those property types only since 2012 and it is difficult to build an adequate statistical model. There is other historical data however showing that the price-to-rent ratio during the bubble years was at most 60 percent higher than its long-run average. This implies that home prices can grow 60 percent faster than rent so Liu uses that as a rule of thumb to assess whether a market is overvalued.
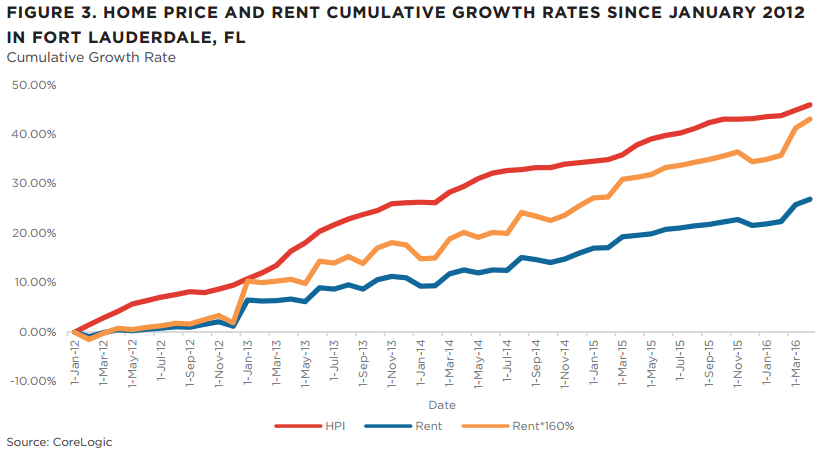
To demonstrate this Liu graphs the results for Fort Lauderdale (Figure 3), plotting the cumulative growth of home prices (red line) and rents (blue line) since 2012. In this case the rent growth is 27 percent and the home price growth 46 percent. He then inflates the actual rent growth by 60 percent (yellow line) to replicate the maximum deviation of the price-to-rent ratio in the bubble years. Any home price that is above that yellow line, as in Fort Lauderdale, is considered overvalued.
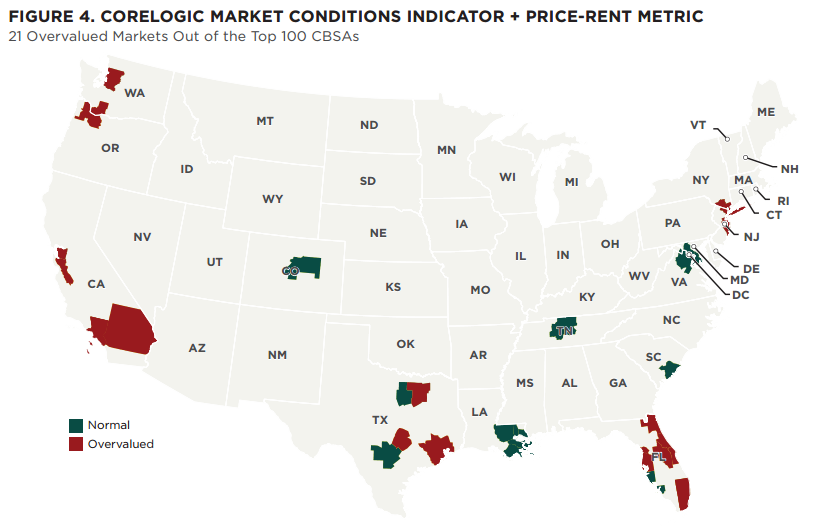
Applying this price-to-rent formula to the 31 markets identified as overvalued using the Market Condition Indicate weeds out 10 that do not exceed the second metric. This leaves mainly the West Coast, Texas, and Florida markets and a scattering in the Northeast. "The counterpoint is that CoreLogic's analysis doesn't seem to account for generally falling mortgage rates, or the marginal, implied cost reduction associated with the tax benefits of owning vs renting," notes MND's Matthew Graham. "I have no doubt that some of these areas deserve the 'overvalued' label, but perhaps not by such clear margins as stated in the Fort Lauderdale chart. It's good to remember that many buyers decide what value they can afford based on monthly payments, so we miss out on a modicum of relevance by comparing top-line home prices with a monthly rental payments."
In Part II of his analysis Liu examines his two metrics that measure evidence to support the Stiglitz theory about future prices. MND will summarize that analysis in an upcoming article.


