The August Mortgage Monitor report released on Monday by Lender Processing Services, Inc. (LPS) paints a mixed picture of the current state of foreclosures in the U.S. It is hard to tell if the situation is improving at the same time the steps necessary to clear the system are accelerating or if we are starting a new cycle of problems.
Foreclosure starts rose from 207,223 in July to 247,957 in August, an increase of nearly 20 percent, the highest level of the year but a 12 percent improvement from 282,528 starts in August 2010. The foreclosure rate remained at 4.11 percent, identical to the July figure but up substantially from 3.80 percent one year earlier. Of the quarter million foreclosure starts in August, 35 percent were repeat starts.
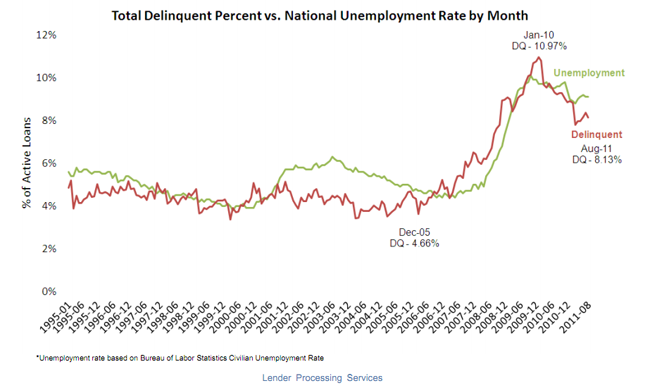
The delinquency rate, which had dropped under 8 percent for the three spring months before rising through June and July fell to 8.13 percent month in August and was down 11.8 percent from the rate one year ago.
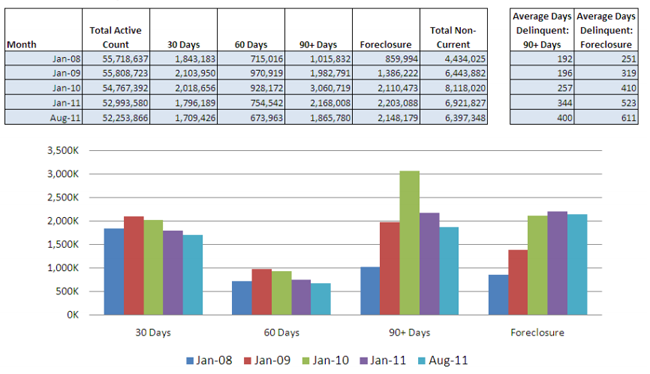
There are approximately 4 million loans that are either seriously delinquent (90 or more days) or in foreclosure. The subset that is seriously delinquent has shrunk to the lowest levels since 2008. Of loans that were current six months previously, 800,000 had fallen into serious delinquency by August, less than half the 2.92 percent rate at the peak in early 2009. About one-quarter of the new delinquencies were loans that had never been delinquent before which LPS called a further sign of an improving trend for new problem loans, however that figure has been almost flat since May. About 667,000 loans rolled from current into 30 day delinquent status in August, down from close to 800,000 in July.
However, of the nearly 46 million loans that were current as of the end of August, 23 percent were still at risk as a result of negative equity - a leading indicator of a borrower's propensity to default as shown by the negative equity among delinquent loans - an average of 45 percent for 30+ loans. While negative equity continues to rise to a high of 72 percent among loans in foreclosure, this is probably more a measure of accruing interest and charges than any indication of a cause and effect relationship between default and equity. Since late 2005 the delinquency rate has tracked almost perfectly with the unemployment rate in the U.S.
August results showed an all-time high in the number of loans shifting from foreclosure back into delinquent status, suggesting that process reviews and potential loss mitigation activity are continuing. As a result, foreclosure timelines continue to increase; 38 percent of delinquent loans have been in that status for more than two years and the average loan in foreclosure has been delinquent for a record 611 days. Average delinquencies in non-judicial states continue to be about six months shorter at time of foreclosure sale compared to judicial states, where backlogs continue to be extremely high. Foreclosure starts now outnumber foreclosure sales by a factor of three to one.
The pipeline ratio, that is 90+ delinquencies and foreclosures divided by the six month average of foreclosure sales, is three times higher judicial than in non-judicial foreclosure states (104 vs. 31). The highest ratio in judicial states is 650 in New York followed by 594 in New Jersey. North Carolina at 92 has the highest ratio of any non-judicial state.
Foreclosure starts for loans held by the government sponsored enterprises, private investors and in portfolios have converged at about 16 percent of the loans in 90+ day delinquency. This, however, represents a sharp increase in starts over the last month for private and portfolio loans and a leveling off of what was a dropping rate for GSEs. FHA foreclosure starts are at about 12 percent.
The states with the highest percentage of non-current loans (combined rate of foreclosures and delinquencies) during August were Florida (22.8), Mississippi (18.1), Nevada (17.3), New Jersey (15.1), and Illinois (14.6). The national rate is 12.24.