
The S&P CoreLogic Case-Shiller U.S. National Home Price Index accelerated again in July, posting a 5.9 percent year-over-year gain compared to 5.8 percent appreciation in June. The non-seasonally adjusted monthly change was down slightly, 0.7 percent compared to 0.9 percent, while the seasonally adjusted gain ticked up from 0.4 to 0.5 percent.
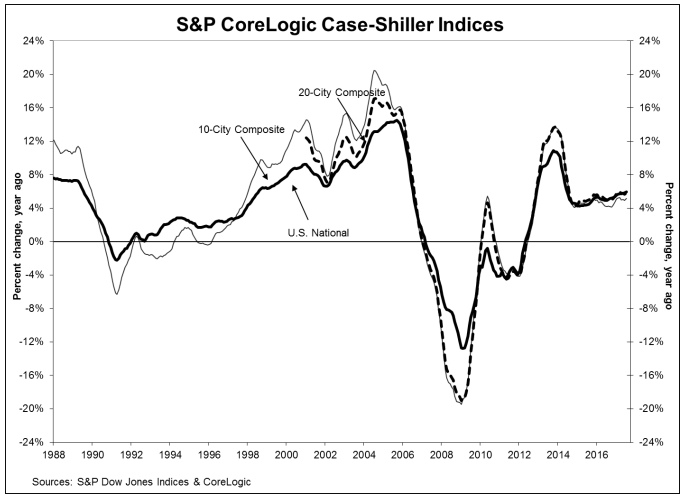
The 10-City Composite rose by 5.2 percent from its level in July 2016, besting the June annual increase of 4.9 percent. That index rose 0.8 percent on a non-adjusted monthly basis and posted a 0.4 gain after adjustment. The 20-City Composite also accelerated, going from a 5.6 percent annual change in June to 5.8 percent in July. The non-adjusted and adjusted monthly indices were up 0.7 and 0.3 percent respectively. All 20 cities had price increases before seasonal adjustment, 17 afterward.
Analysts polled on their expectations for the 20-City Composite were on target with a year-over-year estimate of 5.9 percent and a seasonally adjusted monthly change of 0.3 percent. Econoday, which conducted the survey also advised readers to keep an eye on upcoming Case-Shiller reports for August and September, which will include data on cities hit by the two recent hurricanes.
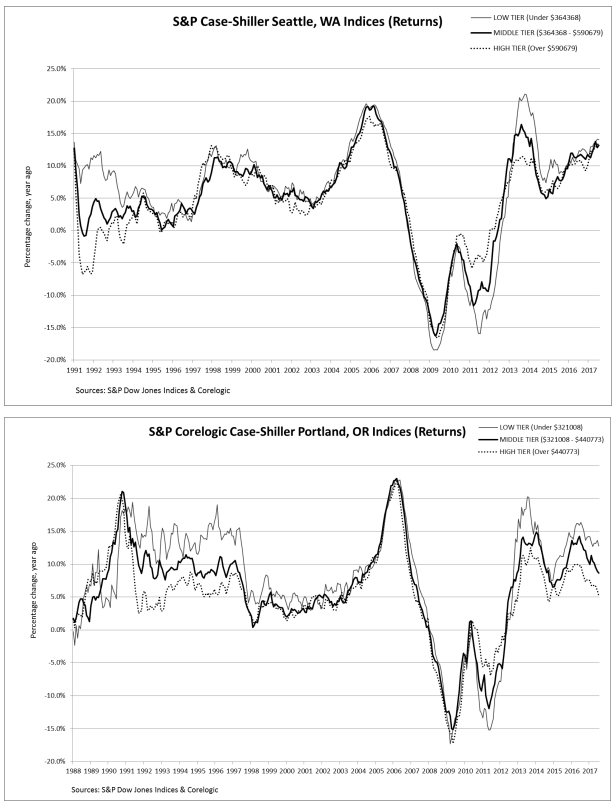
Seattle was again the superstar among the 20 cities covered by Case-Shiller, reporting a 13.5 percent annual rate of appreciation, overshadowing the 7.6 percent increase posted by Portland, Oregon and Las Vegas's 7.4 percent gain. Twelve cities reported greater price increases in the year ending in July versus the year ending June. Both Seattle and Portland's annual returns show housing prices in the highest tier to be the most stable while housing prices in the low tier are the most volatile.
David M. Blitzer, Managing Director and Chairman of the Index Committee at S&P Dow Jones Indices provided the following analysis of July's results. "Home prices over the past year rose at a 5.9 percent annual rate," he said. "Consumers, through home buying and other spending, are the driving force in the current economic expansion.
"While the gains in home prices in recent months have been in the Pacific Northwest, the leadership continues to shift among regions and cities across the country. Dallas and Denver are also experiencing rapid price growth. Las Vegas, one of the hardest hit cities in the housing collapse, saw the third fastest increase in the year through July 2017.
"While home prices continue to rise, other housing indicators may be leveling off. Sales of both new and existing homes have slipped since last March. The Builders Sentiment Index published by the National Association of Home Builders also leveled off after March. Automobiles are the second largest consumer purchase most people make after houses. Auto sales peaked last November and have been flat to slightly lower since.
"The housing market will face two contradicting challenges during the rest of 2017 and into 2018. First, rebuilding following hurricanes across Texas, Florida and other parts of the south will lead to further supply pressures. Second, the Fed's recent move to shrink its balance sheet could push mortgage rates upward."
As of July 2017, average home prices for the MSAs within the 10-City and 20-City Composites are back to their winter 2007 levels. The National Index is now 5.1 percent higher than its pre-recession peak in the summer of 2006. The two composites are not yet fully recovered and remain 2.2 percent below the 20-City peak and 4.8 percent lower for the 10-City. All indices are at least up 45 percent from the lows set in early 2012.
The S&P CoreLogic Case-Shiller Home Price Indices are constructed to accurately track the price path of typical single-family home pairs for thousands of individual houses from the available universe of arms-length sales data. The National U.S. Home Price Index tracks the value of single-family housing within the United States. The indices have a base value of 100 in January 2000; thus, for example, a current index value of 150 translates to a 50 percent appreciation rate since January 2000 for a typical home located within the subject market.
The National Index has a new all-time high of 194.00, up from last month's peak of 192.60. The 10- and 20-City Composites had readings of 215.50 and 201.99 respectively. Los Angeles claims the highest index reading at 266.27 and Cleveland the lowest at 116.89.


