
Home prices made an unexpected surge in July the Federal Housing Finance Agency said today. The month-over-month change was +0.6 percent while, according to Econoday, analysts had been looking for an increase of 0.4 percent. It was the largest month-over-month change in the index since January's 0.7 percent rise. The increase from May to June had been a mere 0.2 percent.
On an annual basis the HPI was up 5.8 percent and is now 1.1 percent below its March 2007 peak. The year-over-year change was the largest since April 2014. The index itself stands at 224.5, roughly the same as in November 2006.
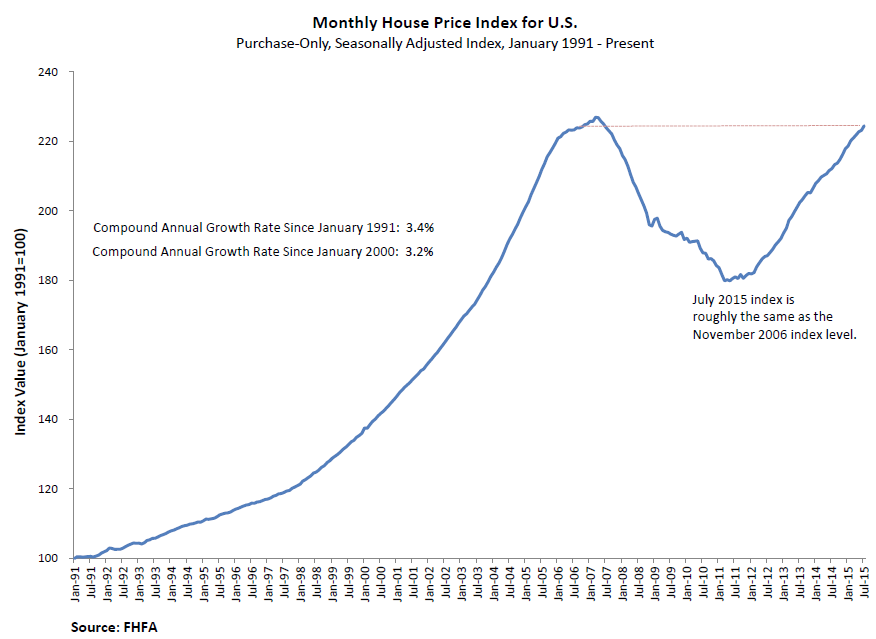
FHFA's HPI is calculated using home sales price information from mortgages sold to or guaranteed by Fannie Mae and Freddie Mac. The purchase-only indexes are normalized to 100 in the first quarter of 1991.
Seven of the nine census divisions posted positive seasonally adjusted monthly price changes from June 2015 to July 2015. These ranged from -1.2 percent in the New England division to +1.6 percent in the Mountain division. The other negative result was in the East North Central division which was down 0.1 percent. The 12-month changes were positive in every region, ranging from +2.1 percent in the New England division to +9.4 percent in the Mountain division.


