
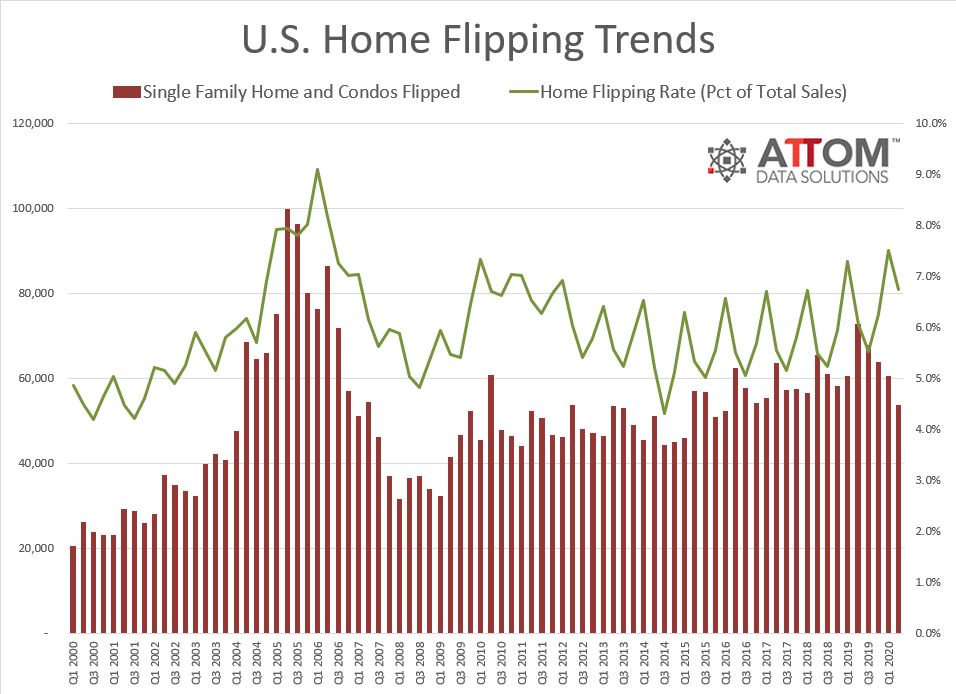
One out of every 15 home sales in the second quarter of the year were defined as "flips" by ATTOM Data Solutions. A flip is any arms-length transaction that occurred in the quarter where a previous arms-length transaction on the same property had occurred within the last 12 months.
ATTOM's second quarter report on flipping says 53,621 single-family homes and condos were flipped in the second quarter, 6.7 percent of total transactions. This is down slightly from 7.5 percent or one of every 13 transactions in the first quarter, but up from 6.1 percent or one in 17 in the second quarter of last year.
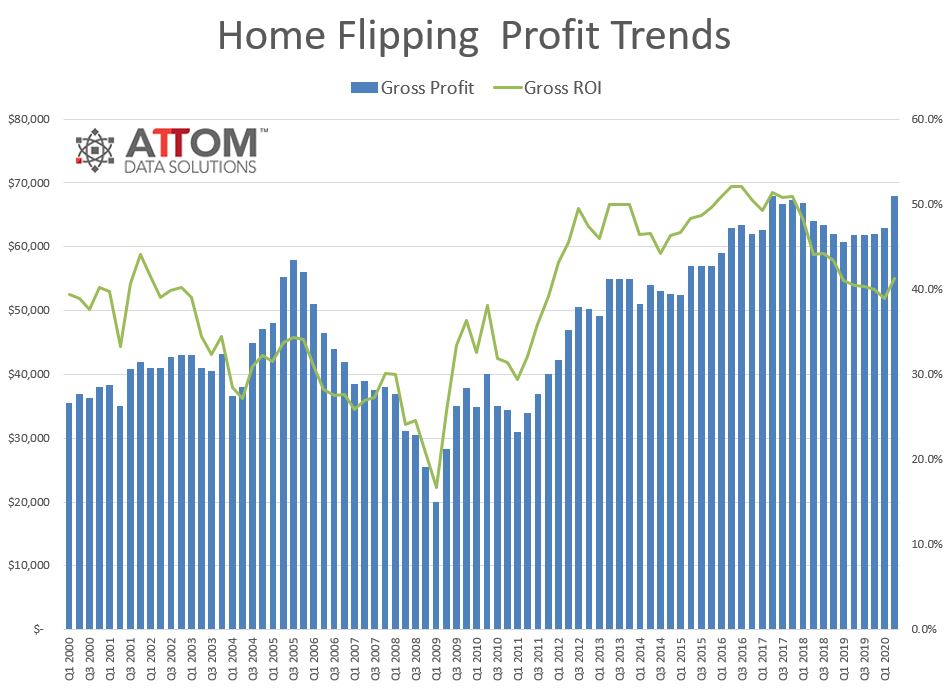
While flipping declined slightly last quarter, both profits and profit margins were up. The median sales price of second quarter flips was $232,402 and the median paid by the investor was $164,500. This resulted in a gross profit on the typical home flip nationwide of $67,902. This 41.3 percent return on investment (ROI) was the highest since a 43.4 percent return in the fourth quarter of 2018. Both the gross profit and in ROI in the quarter were higher than the prior quarter's $63,000 profit and 38.9 percent ROI and the $61,900 and 40.4 percent netted a year earlier. The second quarter ROI marked the first quarterly increase since the third quarter of 2018 and the first year-over-year gain since the fourth quarter of 2017.
The opposing trends - the flipping rate down but profits up, reflect the situation nationwide as the coronavirus depressed home sales but not prices. As sales fell, those home seekers who were able and willing to take advantage of historically low mortgage rates ventured into the market and competed for a reduced supply of homes for sale.
"Home flipping was a study in contrasts in the second quarter of 2020, as the flipping rate went one way and profits went the other," said Todd Teta, chief product officer at ATTOM Data Solutions. "Far fewer house hunters were out in the market looking for homes, which probably cut into the pool of potential buyers that investors could tap. But at the same time, home flippers who were able to close deals did better than they had done in a year and a half. That likely flowed in large part from extremely low interest rates that enticed buyers who remained employed and were willing to house-hunt within social distancing requirements."
The decline in flipping from the first to second quarter was broad based, occurring in 114 of the 151 metropolitan statistical areas analyzed in the report (75.5 percent). (Metro areas were included if they had at a population of 200,000 or more and at least 50 home flips in the second quarter of 2020.) The largest decreases were in Durham, North Carolina at 40.7 percent, Provo Utah, and Boston with declines of 36.6 percent and 35.1 percent, respectively.
There were also areas where flipping increased. The top three in that category were Salisbury, Maryland where the rate was up 45.8 percent, and two Florida metros, Fort Myers (up 20.2 percent) and Tallahassee, (16.8 percent.)
Profit margins increased from the second quarter of 2019 to the second quarter of 2020 in 95 of the 151 metro areas with enough data to analyze (62.9 percent). The biggest gains were in Fort Collins, Colorado, up 167 percent; Johnson City, Tennessee (up 115 percent); and Cedar Rapids, Iowa (up 100 percent).
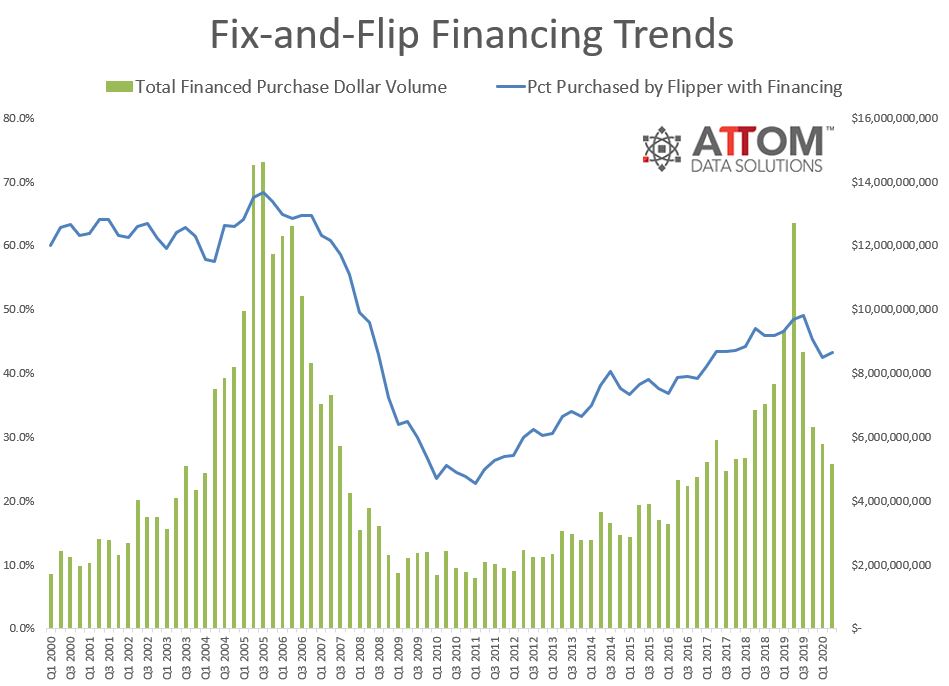
Nationally, the portion of flipped homes investors purchased with financing increased in the second quarter of 2020 to 43.3 percent, from 42.5 percent in the first quarter of 2020, but still down from 48.5 percent in the second quarter of 2019. Meanwhile, 56.7 percent of homes flipped in the second quarter of 2020 were bought with all cash, down from 57.5 percent in the prior quarter, but still up from 51.5 percent a year earlier.
Home flippers who sold homes in the second quarter of 2020 took an average of 183 days to complete the transactions, up from an average of 174 in the first quarter of 2020 but down from 184 days in the second quarter of last year.


