Written by:
Bill Berliner--Principal, Berliner Consulting & Research
Paul Jacob--Director of Research, BOM Capital LLC
While the level of new delinquencies on residential mortgage loans has stabilized, the size of the “foreclosure pipeline” continues to grow. According to recent reports from RealtyTrac, just under two million homes in the United States are in some stage of foreclosure. In its most recent delinquency survey, the Mortgage Bankers Association reported that 3.85% of all U.S. mortgages are in foreclosure; within the Bloomberg securitized non-agency database, a staggering 21.9% of all loans are 90 or more days delinquent, as of August.
The size of the foreclosure pipeline, and how the foreclosure pipeline operates, directly impacts loss severities and investor returns on non-agency mortgage-backed securities. Factors such as the length of time needed to resolve the disposition of non-performing loans, the portion of loan proceeds recovered, and the position of the subject bond in a deal’s capital structure impact expected yields and cash flows on MBS investments. In addition, a variety of additional industry- and government-driven factors will also impact severity experience. However, the complex nature of these factors and the resulting uncertainty they inject into the process complicate investors’ ability to forecast losses and project cashflows
This report will examine a number of issues related to the impact of the growing pipeline of foreclosed loans on investors. We first address the fundamentals of the foreclosure process from the perspective of servicers and the investment trusts (or trustees). We then look at some industry data on delinquencies and their transitions into either current or foreclosed loans. In order to view the impact of a variety of factors on loss severities over time, we then create some simple illustrations showing severity estimations using two dissimilar products (subprime ARMs and negative-amortization Option ARMs) as proxies. Finally, we discuss a variety of factors that complicate loss severity calculations and trends
Our goal is to show that using standard assumptions for loss severities (e.g., that option ARM severities are always higher than other products) can be too simplistic, especially as the process for moving loans through the foreclosure pipeline slows. In particular, we attempt to address the idea that the passage of time impacts both the absolute and relative levels of loss severities. In an environment where the processing of homes in the foreclosure pipeline has slowed to a virtual crawl, investors must reckon with the possibility that “recovery lags”—the time from initial delinquency to liquidation—will routinely lengthen, perhaps to eighteen months or longer. In addition, the impact of longer recovery lags will vary across products. Holding factors such as loan size constant, loss severities for products with higher accrual rates will, over time, equal or exceed those for lower-rate products, even if the balance of the latter increases through negative amortization.
Elements of the Foreclosure Process
There are a number of things that make addressing the foreclosure pipeline tricky and problematic. One is the plethora of provisions governing how seriously delinquent loans are processed. Outlined in a deal’s Pooling and Servicing Agreement, the provisions vary by both originator and issuance year. In addition, the servicer is often called upon to make subjective judgments on issues such as the recoverability of advances; as discussed later in this report, these decisions can have a significant impact on severity experience.
Review of the Loss Severity Calculation
The calculation of losses for an individual loan is fairly straightforward. As shown in Exhibit 1, the proceeds received in the liquidation process include both the net sale price of the property and, if applicable, proceeds from mortgage insurance. These amounts are reduced by the servicer’s ability to recover its costs. While the largest costs typically result from principal and interest advances to the trust (which are made at the note rate less the servicing fee), other costs are also recoverable. These include escrow advances and property maintenance costs (which grow over time), as well as the costs associated with foreclosure and/or the sale of the property (attorney fees, appraisals, BPOs, etc.). The latter are mostly fixed in nature and not dependent on elapsed time.
Factors Impacting Severity
Clearly, the most significant factor impacting loss severity experience is the state of the real estate market in the area in which the property resides. Depending on trends in the market, the sale price will rise and fall over time; in the current environment of weak real estate markets, it is reasonable to expect that an elongated foreclosure pipeline will result in lower sale prices on foreclosed homes. In addition, the large number of foreclosed properties in many markets has created an additional “foreclosure discount,” in which foreclosed properties are expected to sell at discounts to comparable homes being sold through normal channels. (At this writing, the discount is widely assumed to be around 15%.) As the foreclosure pipeline continues to grow, the foreclosure discount is more likely to expand further than to shrink.
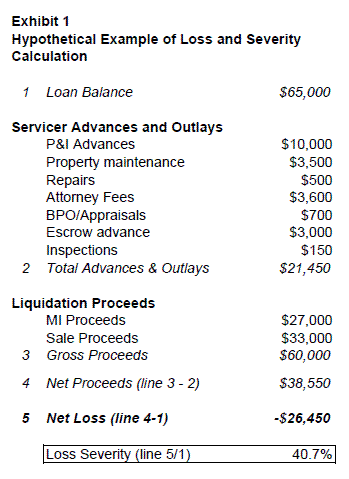
Exhibit 1 also illustrates how loan size impacts loss severity percentages. Many of the costs associated with the foreclosure process are fixed; for example, lawyers don’t bill based on the loan balance and/or the property size. This means that smaller loans will have higher percentage loss severities than larger loans, all other things equal. With respect to time-dependent outlays, however, principal and interest advances are typically the largest costs borne by the servicer. As noted above, they also accrue over time. This means that both the elapsed time between when a borrower ceases making scheduled payments and the loan is liquidated, as well as the net accrual rate being advanced by the servicer, are highly important to recoveries.
Recent Trends in Delinquency and Foreclosure Pipeline Duration
Several factors have contributed to a substantial extension of the time lags between delinquency, foreclosure and liquidation. For one thing, the staggering quantity of troubled loans has made it extremely difficult for servicers to keep up with volumes, as this aspect of the servicing business is proving difficult to scale-up quickly. Mergers in the banking sector have forced many of the largest servicers to deal with consolidation of systems. And the imposition of foreclosure moratoria and, more recently, government-mandated loan modification programs has further complicated the problem.
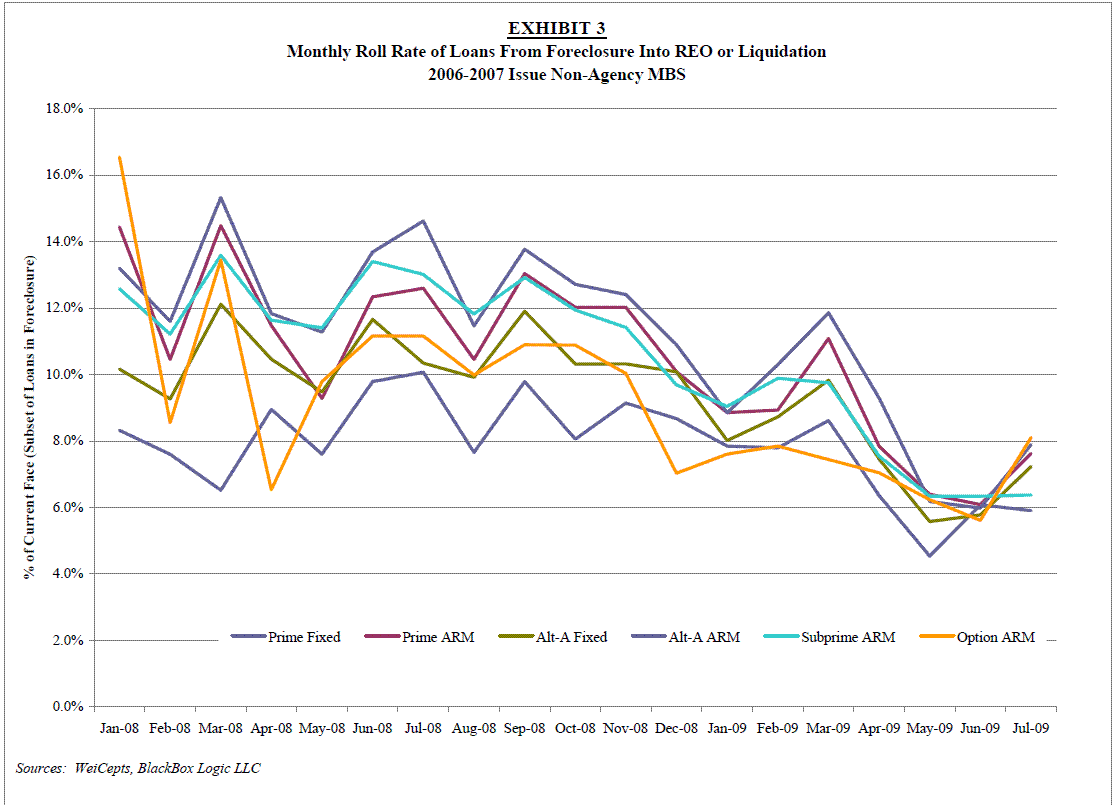
Exhibits 2 through 5 give a picture of the severity of the pipeline blockage, both in non-agency MBS and the non-securitized mortgage universe. Exhibit 2 tracks monthly roll rates from 90+ day delinquency into foreclosure, bankruptcy or REO for different sectors of non-agency MBS. At the beginning of 2008 – when volumes were more manageable – 35-45% of D90+ loans rolled into Foreclosure, Bankruptcy, or REO each month. Now, just 15-25% of D90+ loans are getting moved along. The exhibit give a clear picture of the mechanism behind the backlog, and implies a substantial lengthening of the time lag between initial delinquency and final liquidation. Exhibit 3 tracks the monthly movement of non-agency MBS loans from Foreclosure into either REO or liquidation, a process that has also showed a slowing trend over the past year-and-a-half.
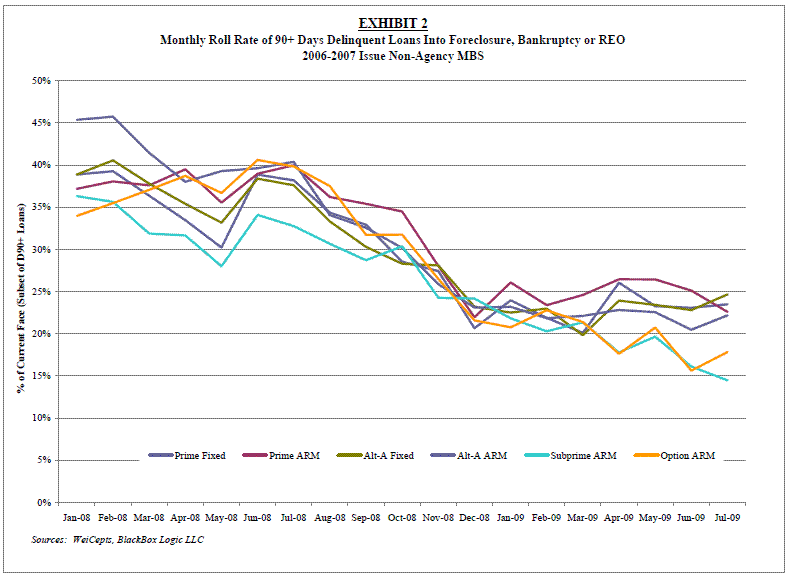
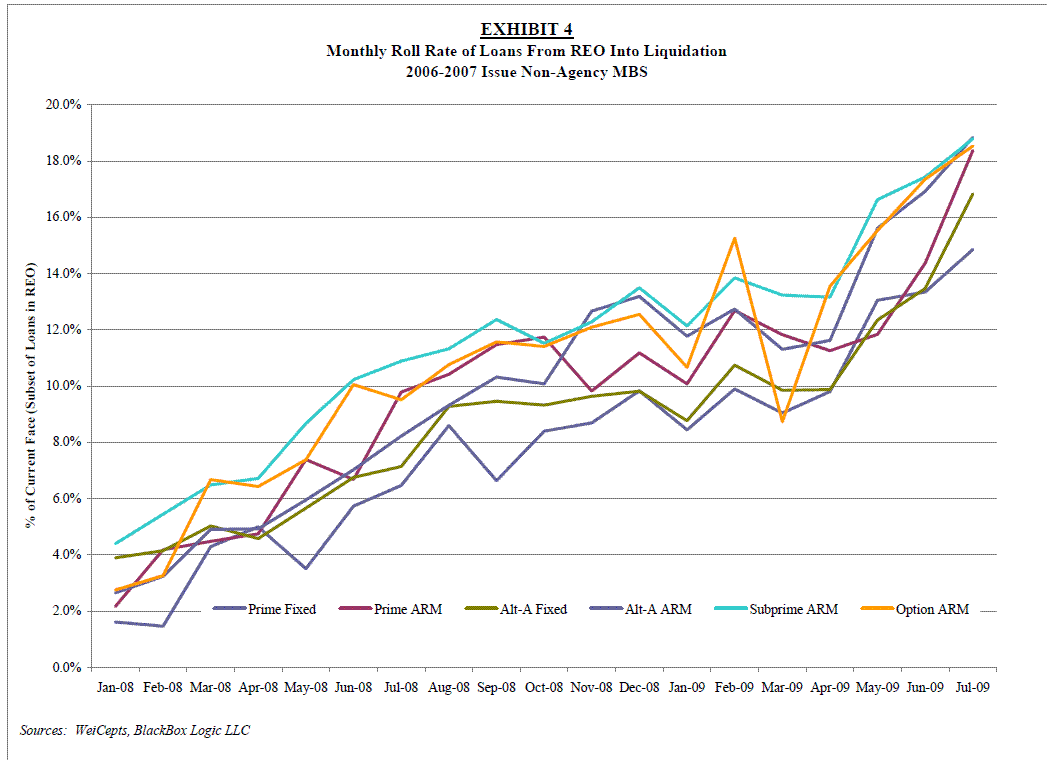
In contrast, once loans get into REO, the speed at which they’re being liquidated has been increasing, as illustrated by Exhibit 4. The contrast between the charts in Exhibits 2 and 4 is striking. A couple of possible reasons come to mind:
- Improvements in the overall housing market may have helped properties move out of REO more quickly in 2009 Q2.
- Servicers may have had more success at scaling up REO processing to handle greater volumes than they’ve had at ramping up the processing of distressed loans.
Finally, Exhibit 5 gives a slightly different look at a much larger loan universe, from the MBA delinquency survey. Here, we show quarterly foreclosures started as a percentage of 90+ day delinquencies at the end of the previous quarter. This measure is somewhat analogous to Exhibit 2, painting a nearly identical picture over a broader population. This data confirms that the pipeline blockage phenomenon is not confined to non-agency MBS, but is endemic to the entire system.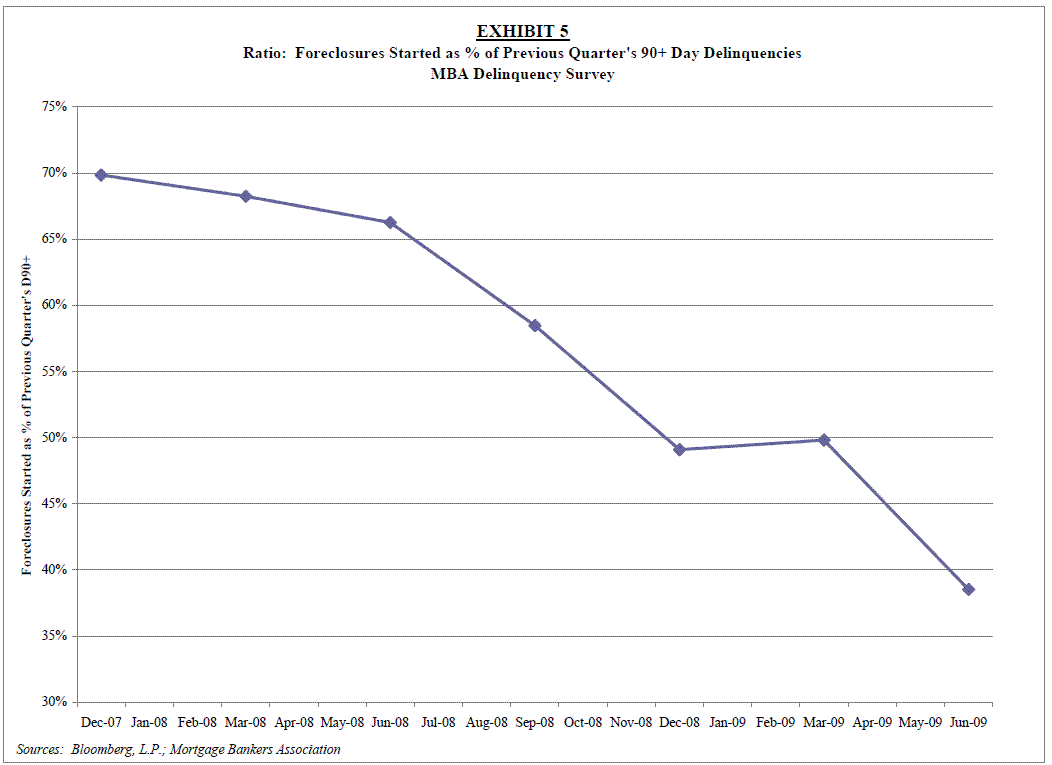
Hypothetical Comparison of Loss Severities—Subprime versus Option ARMs
The previous discussion suggests that some general assumptions on loss severity need to be examined. For example, a standard assumption made by investors is that option ARMs (where borrowers can negatively amortize their loan balances) will have higher loss severities than other products, due to borrowers’ ability to make sub-IO payments and thus negatively amortize their loans. Especially in the later vintages, most option ARM loans did experience some negative amortization, particularly during the period in mid-2007 when 12-month MTA (the index to which these loans are typically pegged) rose to over 5%, putting their accrual rates over 7%(footnote 1) .
An interesting and useful exercise is to compare the potential loss severities for hypothetical option ARM and subprime ARM loans. Option ARMs have two major characteristics that impact severities. One is obviously the borrowers’ ability to negatively amortize their loans by deferring interest payments. In addition, the accrual rate for most option ARM products is currently very low, since they generally accrue at 12-month MTA plus 250-350 basis points. (With MTA below 1%, most option ARMs are currently accruing at between 3.5% and 4.5%.)
By way of comparison, subprime loans were typically originated with very high reset rates, as 12-month LIBOR plus 700 basis points was a fairly common provision. (Both borrowers and lenders were typically focused on the loan’s original rate and not the reset margin, since it was assumed that surviving borrowers would refinance out of the loan at the first reset.) However, subprime loans (thankfully) did not allow for negative amortization.
Therefore, the two products provide an interesting framework for comparing two extremes. Option ARMs represent a product that accrues at very low rates but allows for negative amortization; subprime ARMs were generally made as amortizing loans but have very high accrual rates. This makes a comparison between the two products useful in assessing how the passage of time directly impacts advancing rates and, by implication, loss severities.
The following discussion outlines how the “recovery lag,” or the time between the initial delinquency and liquidation, affects accrued losses over time for option ARM and subprime loans. The analysis measures the differences between loss severities for the two products as time passes, and identifies the break-even points in time for the different products’ severities. For the purposes of the analysis, we assume that the loans were made against identical properties purchased for $375,000, with original LTVs of 80%. The three parameters subject to change were the percentage decline in the properties’ prices, the amount of negative amortization on the option ARM, and the accrual rate spread between the products.
Before proceeding, note that this comparison has a number of simplifying assumptions. As described, the hypothetical analysis assumes that both loans have the same original balance. However, the average initial balances of option ARMs originated between 2005 and 2007 were significantly larger than subprime loans. In addition, we assumed that all advances consisted solely of interest. Given the low level of accrual rates, we assume that the percentage of negative amortization for the option ARM is fixed at time zero; put differently, no additional negative amortization takes place over time. Finally, the declines in home prices are held constant beginning at time zero. Of course, in reality home prices change over time, and (as noted previously) represent a two-sided element of risk that increases with elapsed time over an extended foreclosure timeline.
Comparisons of Estimated Severities as Time Elapses
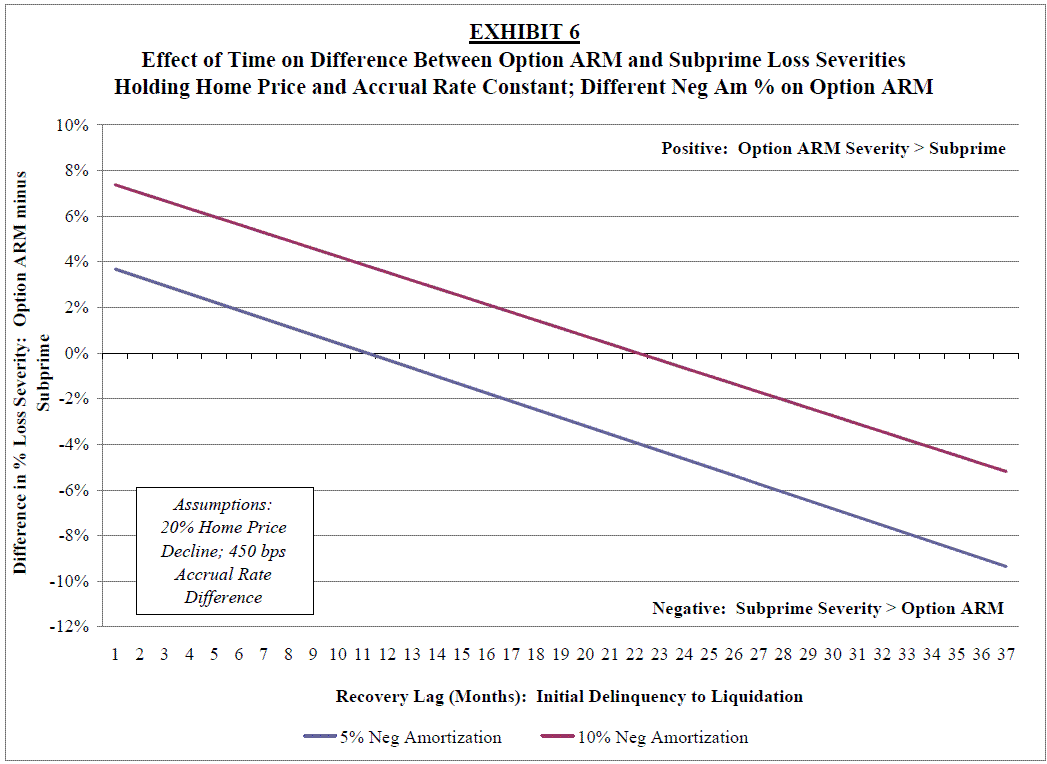
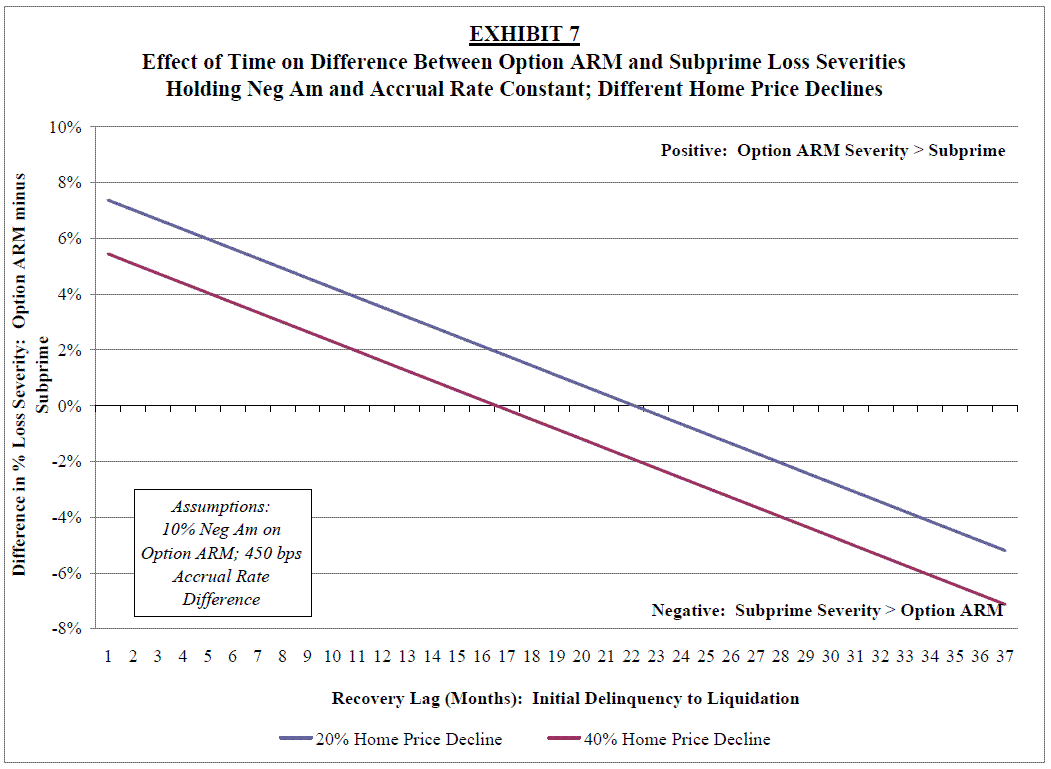
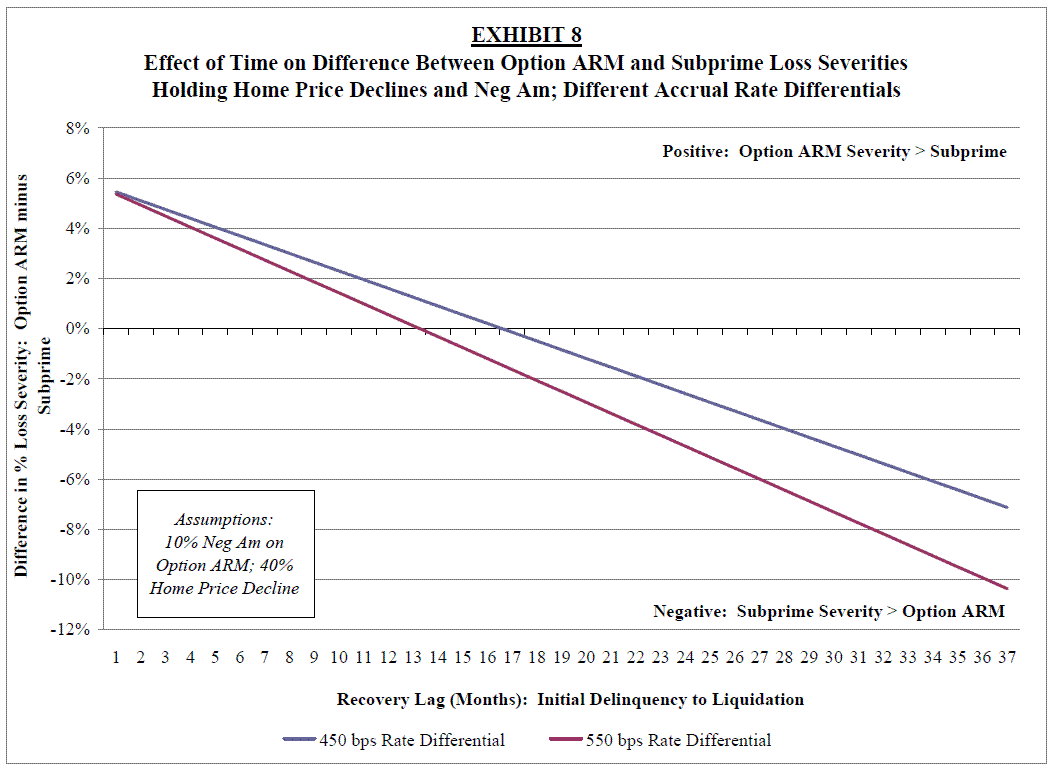
Exhibits 6-8 show how time in foreclosure affects the estimated differences in loss severities between the hypothetical subprime and pay-option loans under various scenarios. Exhibit 6 focuses on different levels of negative amortization for the pay-option loan; Exhibit 7 looks at different levels of home price decline, while Exhibit 8 gauges the impact of differing accrual rates.
In all cases, “instantaneous” (one month) foreclosures favor the subprime loan, simply because of the effects of negative amortization on the pay-option loan. As noted above, however, the subprime loans are assumed to have a higher accrual rate (a difference of 450 bps in Exhibits 6 and 7; 450 and 550 bps in Exhibit 8). Therefore the subprime loan’s severity advantage deteriorates as time to liquidation lengthens, because the servicer has to recover a growing amount of cumulative advances.
Exhibit 6 shows the severity differential (option-ARM minus subprime severities) at two different levels (5% and 10%) of negative amortization (“neg am”) on the option ARM. Under the 5% neg am case, the breakeven point – at which the percentage loss severities are equivalent between the two loans – comes at 11 months. At 10% neg am, it takes 22 months to reach the breakeven point. Exhibit 7 shows the how the time-versus-severity difference function is affected by the degree of home price decline, holding the amount of neg am constant. In Exhibit 8, we show the effects of change the level of accrual rate difference, holding neg am and home price constant.
A Summary of Findings
To summarize, the difference in loss severity between a subprime ARM and an option ARM as time elapses can be characterized as follows:
- They will increase as the amount of negative amortization increases. This implies that the low accrual rates for option ARMs, which will result in little to no negative amortization even for borrowers making minimum payments, are a positive for the product’s relative loss severities.
- They decrease as the percentage decline in home prices increases. This is simply because, beyond a certain point, the decline in value of the property overwhelms all other factors. In that case, the two products’ loss severities for loans made in areas that have experienced severe declines in home prices, and/or markets where prices continue to slide, should ultimately converge. The impact on home prices resulting from an increase in the previously-noted “foreclosure discount” would also tend to close the severity differential.
- The also decrease as the rate differential between the two products increases. Given current rates for 12-month MTA and cash LIBOR, it is fair to assume a rate differential of around 450 basis points between option ARMs and subprime loans. This substantial rate differential acts to close the difference in severities between the two products. Moreover, MTA should continue to decline over the next 6-12 months; depending on whether and when the Fed raises the Fed funds target rate, MTA could fall to 0.6% or lower, which (holding LIBOR constant) will probably increase the differential by another 40-50 basis points.
It is important to note that while the breakeven points appear long at first glance, they are realistic in the current environment of a rising number of foreclosure and a severely clogged foreclosure pipeline. For example, as of July 2009, we estimate that the average seriously delinquent loan (D60+) in a Countrywide pay-option deal hasn’t been current for twelve months, while the average loan in foreclosure hasn’t been current for 17 months (footnote 2). Also, as discussed previously, recent trends indicate slower, not faster, processing of seriously delinquent loans.
Finally, it should be emphasized that these findings should not be interpreted as a forecast of loss severities per se. For example, Option ARM severities have been increased by the fact that the areas in which their issuance was concentrated have undergone severe declines in home prices, leaving much of the Option ARM universe deep under water. These types of factors, addressed in the following section, can have a profound impact on actual severity experience. The objective of this report is rather to identify the various factors that contribute to losses and loss severities in the context of the growing foreclosure pipeline.
Factors Complicating Loss Severity Estimation
The above discussion outlines some of the primary factors that drive losses and impact loss severities, as well as their sensitivity to a lengthening foreclosure timeline. However, there are additional elements that complicate the estimation of losses at both the trust and tranche levels.
Structuring Complexities and Variations
Any discussion of bondholder losses has to account for variations in how deals allocate cash flows and losses. These provisions are typically deal-specific, and can vary substantially across transactions. Moreover, the nature of the paydown provisions often creates different interests for bondholders at different levels of the capital structure. The impact of these differences is exacerbated in the current environment, which is characterized by huge numbers of foreclosures, a long pipeline, and large-scale loan modification efforts. (This is largely because virtually no one that wrote the prospectuses and PSAs anticipated the current dislocations. Thus, many decisions being made by servers and trustees are ad-hoc in nature.)
It is also difficult to generalize with respect to how certain provisions will be treated, as there are many variations across loans types and issuers. As an example, Shifting-Interest structures typically contain a single waterfall structure for all cashflows (i.e., principal and interest combined), while Excess Spread deals generally have separate waterfalls for principal and interest.
Geography
A series of factors result directly and indirectly from geographic differences. Some are both obvious and easy to measure. As described above, changes in home prices have the most significant impact on loss severities, and are in turn driven primarily by changes in local and regional market conditions. In addition, loan size (another key factor in severity) is strongly influenced by the underlying property’s location.
However, servicer advances are also impacted by state-level differences in property tax rates. As indicated in Exhibit 1, tax and insurance escrows are advanced by the servicer. Tax rates vary significantly by state; some states (such as New Jersey) have notoriously high property tax rates, while property taxes in California are held down as a result of Proposition 13, passed in the late 1970s. While the dollar amounts associated with escrow advances is smaller than for P&I, the impact of extending the foreclosure timeline suggests that loans made in states with high property tax rates will exhibit higher loss severities than those made in low-tax states, all things equal.
Finally, the timetables for processing loans in the foreclosure pipelines vary due to state-specific legal factors. It is broadly understood that states employing a judicial foreclosure process (i.e., where foreclosures are processed through the courts) will have much longer liquidation times than those states where foreclosures are processed outside the court system.
Servicer Advancing: Obligations and Options
The above discussions and examples assume that servicers will continue to advance through the entire period that the loans remain in foreclosure. However, servicers often have the option to cease advancing when they deem the advances to be “non-recoverable.” It does not appear that there are any uniform standards with respect to the non-advancing option, which can vary by issuer, vintage, and product. (For example, older deals typically contain less flexible language; in many such cases, the servicer must continue to advance until the underlying home is sold.) The decision to cease advancing based on the servicer’s inability to recover is based, in large part, on a loan’s current LTV ratio. (Higher current LTVs mean that advanced payments are less likely to be recovered after the underlying property is liquidated. Deals that allow for servers to stop advancing typically base the option on a good-faith estimate of the likelihood of recoveries.)
Note that the servicer’s advancing decision does not impact the ultimate dollar loss experienced by the trust. If the servicer continues to advance until the property is sold and the loan liquidated, advances are paid back to the servicer from the proceeds of the sale. If the servicer stops advancing, the trust does not have advances to repay from that point forward. For example, if the servicer advanced $5,000 against a delinquent loan with a $100,000 balance and the sale netted $75,000, the trust received a total of $80,000; reimbursing the servicer for the $5,000 leaves the same $75,000 for the trust that it would have if the servicer made no advances.
However, servicer advancing decisions can have a major impact on different bondholders within the deal. Consider, for example, a mortgage ABS deal where principal and interest payments each have separate waterfalls. If the servicer continues to advance until delinquent loans are liquidated, the trust continues to receive interest to pay to bondholders. If the servicer stops advancing, however, interest payments to the trust are reduced, to the point where some bonds (starting with the lower-rated tranches) will not have enough interest to make the full interest payment. This results in the creation and accumulation of interest shortfalls.
By contrast, the net amount recovered upon liquidation is typically characterized as principal, and is therefore distributed to the bondholders based on the principal waterfall. In this case, the subordinate holders will receive no interest, and little (if any) principal from recoveries, irrespective of the amount of shortfall accrued by the tranches. Therefore, a decision by the servicer to stop advancing would hurt the holders of so-called credit IOs (i.e., subordinate bonds expected to receive no principal and are valued based solely on the amount and duration of interest payments).
A similar point can be made for cashflow allocations in a Shifting-Interest (RMBS) deal. If the servicer stops advancing, the interests of WAC IO holders (who receive the difference between the deal’s net note rate (and the deal’s structuring coupon) would also be damaged.
Our understanding is that while servicer advancing decisions have not yet become a major factor in cash flow dispositions, it will be an important issue to watch. Particularly in light of the different provisions noted previously, investors in a variety of classes will need to look at each deal’s Pooling and Servicing Agreements (PSAs) in order to judge how long, and under what conditions, the servicer may be required to advance.
Mortgage Insurance
As shown in Exhibit 1, reimbursements from mortgage insurance can comprise a significant portion of the proceeds from the liquidation of a loan in foreclosure. While provisions vary, mortgage insurance typically covers some portion of a loan’s value in the event of default. Aside from the obvious issue regarding the MI providers’ claims-paying abilities, a number of other factors come into play. One is that the presence (or lack) of MI must be considered when evaluating a deal. Some products are more likely than others to have MI (e.g., subprime loans rarely carried insurance), while some deals used variations on MI as part of the overall credit enhancement. (So-called deep MI policies were purchased at the pool level, and covered a larger percentage of losses than typical MI policies). Also, the presence of MI skews the estimation of severity based on LTV. For example, assume that an MI policy on a loan with an original LTV of 95% covers the loan to 80%. In that case, a 20% drop in the home value implies a 5% loss to the trust, versus the full 20% loss being borne by the trust for an 80% original LTV that did not require MI.
Loan Modifications
An in-depth discussion of modifications is well beyond the scope of this article; the issues are quite complex and controversial, and policies and practices are still evolving. However, a few issues related to recoveries and loss severities are worth noting.
The issues raised in the earlier discussion of the complexities associated with deals’ payout provisions are magnified when modifications are brought into play if the modified loans eventually re-default. As with the earlier discussion of servicer advances, the question is not how much is lost by the trust but what happens to the interests of different bondholder classes.
As an example, the Administration’s HAMP modification program allows for loans to receive substantial reductions in note rate – typically down to 1-2% – in order to reduce the borrowers’ debt/income (DTI) ratio. This has the greatest impact on loans with high accrual rates, such as subprime loans. Since the handling of note-rate reductions is generally not addressed in PSAs, trustees are forced to make decisions on how they are treated within the structure. One interpretation would view the change as a reduction in the deal’s WAC, with resulting shortfalls considered to be “basis risk.” Under this treatment, all bonds in the structure are theoretically at risk, depending on how much the deal’s WAC is ultimately reduced and whether it remains above each tranche’s coupon rate. Alternatively, the reduced interest payments is considered an under-collection of interest, which is a loss absorbed by the subordinates.
For an option ARM, the treatment is even more nebulous. Since option ARMs currently accrue at much lower rates, their rate cannot be cut enough to significantly reduce their DTIs, especially in light of the 1-2% floor rates assumed under HAMP. In that case, principal must be “forborne” by the servicer. The classification of principal forbearance (as opposed to principal forgiveness) is an unresolved and contentious topic in the MBS community. The U.S. Treasury has given guidance that recommends that forborne principal in a HAMP mod be realized as an immediate writedown to the trust, though it is not yet clear whether servicers will follow this guidance. The issue has obvious ramifications for the allocation of cash flows within the trust, with immediate writedown generally favoring more senior bonds within a deal. In addition, the decision to write down principal in HAMP mods would create enormous spikes in realized CDRs and loss severities. But until such questions are addressed, the impact of modifications on products such as option ARM severities cannot be fully ascertained.
Finally, it is important to note that the pressure on servicers to modify large numbers of loans has had the effect of extending the foreclosure pipeline. In addition to the sheer number of loans, servicers complain that virtually all seriously delinquent loans must be screened for HAMP eligibility, contributing to lengthening liquidation times and the extension of the foreclosure pipeline.
1---Note that in the current rate environment, most borrowers can make the minimum payment and not negatively amortize their loans. This is because the fully-indexed IO payment using 12-month MTA is less than or equal to the required minimum payment. Most option ARM borrowers currently making minimum payments are positively amortizing their loans at this time.
2---See Analysis: Outlook for Countrywide Pay-Option ARMs, BOM Capital LLC, 8/14/09.


