
Whether due to lessons learned from the foreclosure crisis, an improved economy, or a combination of these and other factors, Black Knight, in its current Mortgage Monitor, shows that foreclosure prevention measures can work. The company says that the reperforming loan (RPL) market now has nearly 1.84 million borrowers who are current on their mortgages. At some point each of these was at least 120 days past due on that obligation. This pool of borrowers represents $306 billion in outstanding mortgage debt. The number of borrowers who have cured serious delinquencies is up by 30,000 since the first of the year as many of those who fell behind due to last year's hurricanes have been able to catch up on their payments.
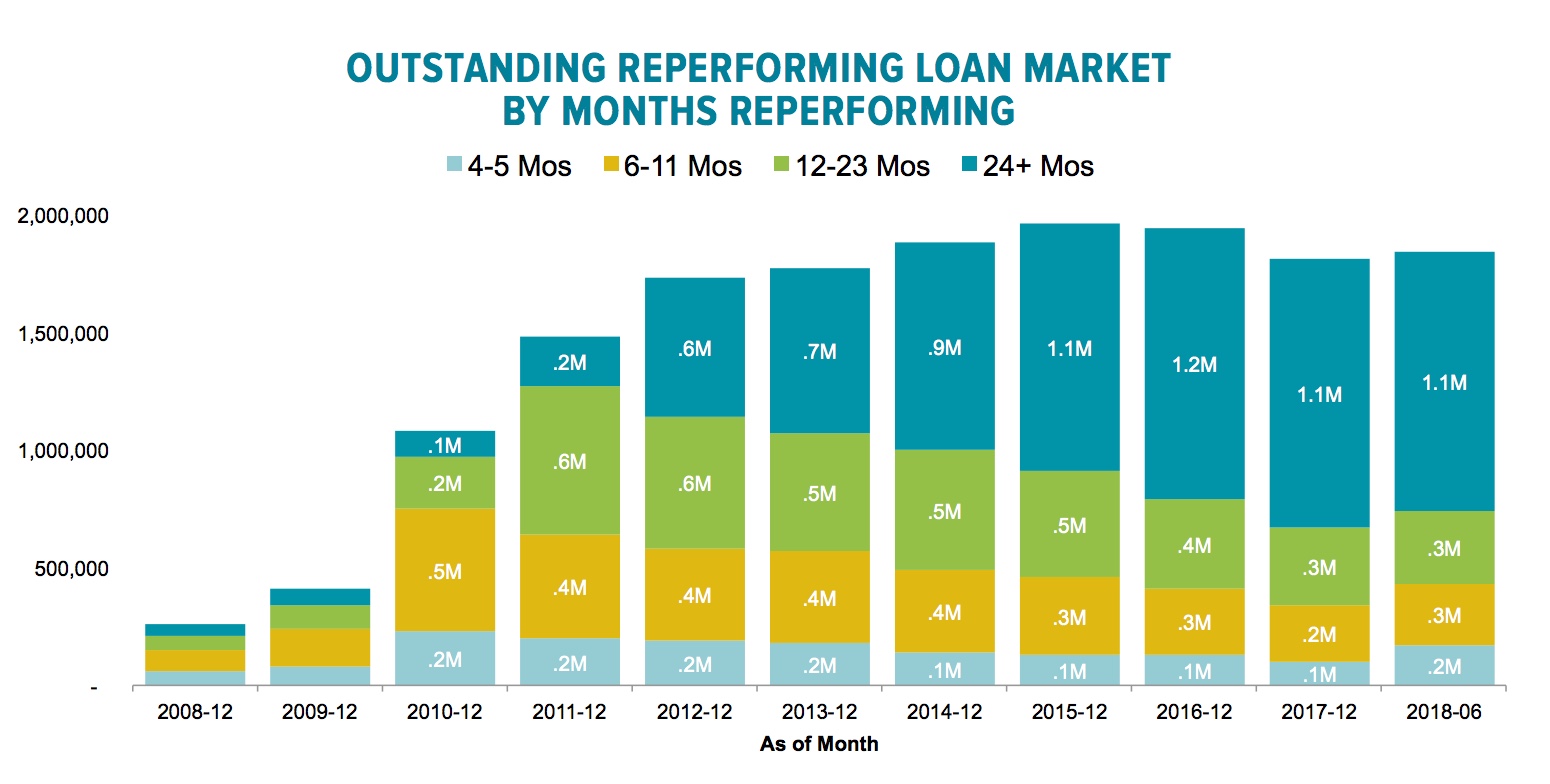
Sixty-percent of these RPL borrowers, about 1.1 million, have been reperforming for more than two years, a number that has held steady over the last three and a half years. Nearly half have current for at least three years, and less than a quarter for five years or more. The average RPL has been reperforming for 39 months.
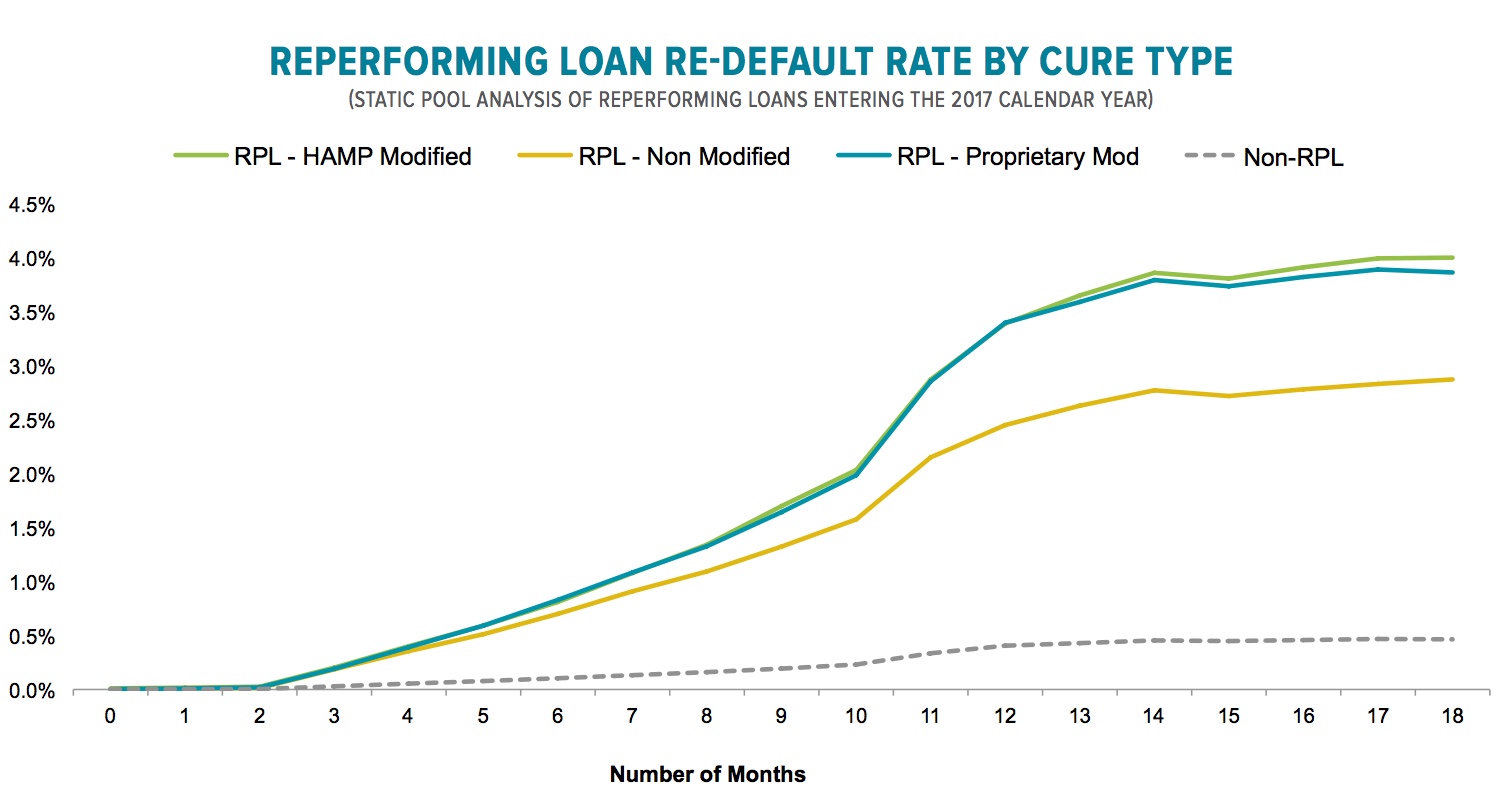
The Monitor says once a loan has been reperforming for more than 24 months, it is 75 percent less likely to redefault than one that just began reperforming.
Most of these RPLs are older loans; only 11 percent were originated in 2010 or later. Two-thirds were originated from 2004 to 2008 with more than half originated in the boom years of 2004 to 2006. The largest share, 550,000 are held in private label securities (PLS), but FHA/VA loans and Fannie Mae/Freddie Mac (the GSEs) are in close second and third positions respectively. Relatively few RPLs are held in portfolios.
Seventy-five percent of the total were modified at least once while 18 percent had multiple modifications. Forty-five percent are operating under proprietary modifications and 30 percent under those completed under the Home Affordable Modification Program (HAMP), the program overseen by the Treasury Department and the Federal Housing Finance Agency (FHFA). The remaining 25 percent returned to performing status without any modification of loan terms.
These loans do remain fragile, exhibiting higher default rates than the traditional loan market. Black Knight's December 2017 loan analysis showed a default rate approximately seven times that of other loans with modified RPLs having a higher rate than non-modified RPLs. Levels of performance between HAMP and proprietary modifications have converged to some degree after early analysis showed HAMP mods significantly outperforming those done under propriety auspices. The Monitor notes the convergence is likely due to several factors including early poor performance among propriety modifications while recent performance has been better. Per-capita benefits have also been reduced among more recent HAMP modifications.
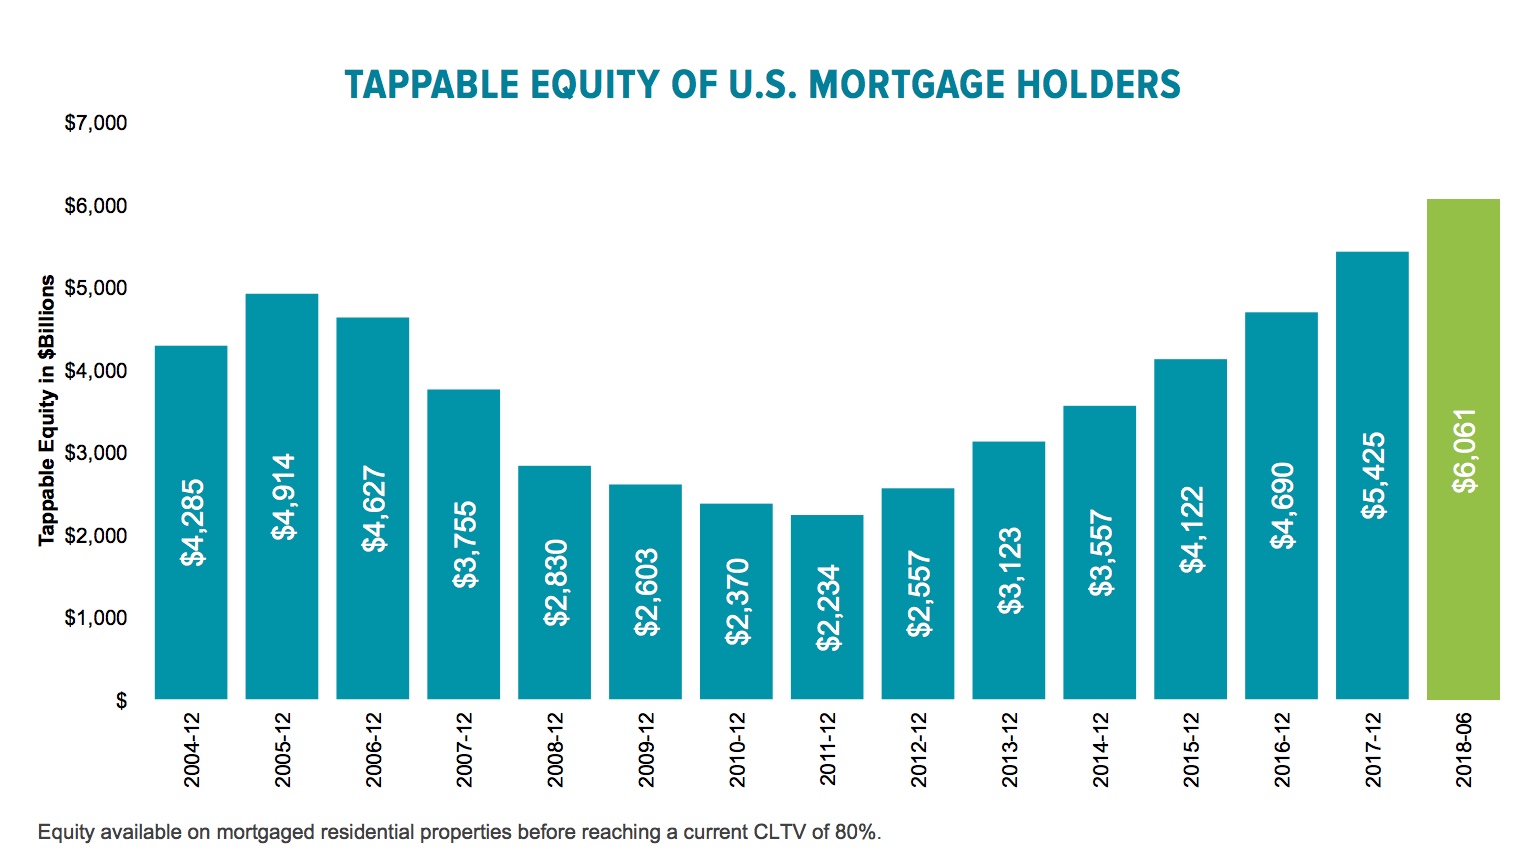
While home price growth has slowed for the last four months, homeowners set a historic first in the second quarter of this year; tappable home equity surpassed $6 trillion for the first time in history. Tappable equity is the amount a homeowner could borrower through refinancing or a home equity line of credit (HELOC) while still maintaining an 80 percent loan-to-value (LTV) ratio. That equity rose by $636 billion in the first half of this year, giving borrowers 2.7 times the tappable equity they had at the 2012 market bottom and 21 percent more than at the previous market peak in 2006. About 44 million homeowners now have such equity available to them.
The growth in the equity does appear to be slowing however. The first two quarters of each year are historically far and away the strongest for such growth, and equity has grown much faster in the first half of this year than in 2017. But the lion's share of this year's newly minted equity came in the first quarter, a $380 billion gain. The second quarter growth of $256 billion, while the fourth strongest quarterly gain since the housing recovery began, was also well below growth in the second quarter of 2017.

After home prices rose by 2.5 percent in the first quarter of this year, the highest first quarter rate in fie years, the market appears to have shifted. Despite Q2's historical role as the leading quarter for home price growth, the annual rate of appreciation, which was 6.8 percent in February, dropped to 6.1 percent in June. The Monitor singles out California where the average home price increase in the second quarter was down 43 percent in what is typically the highest growth quarter of the year.
Further, slowing price gains were evident in many of the most equity-rich metro areas, driving the national decline in equity growth. California's 43 percent quarter over quarter slowdown is actually less notable than the 80 percent drop in home price increases in the highest-priced areas of the state. Seattle too presented evidence of the slowdown; the average price increase was down 60 percent from the first to the second quarter.

But if equity growth is slowing, so apparently is the rate at which homeowners are tapping it. There was $65 billion in equity withdrawn by way of cash-out refinancing or HELOCs in the second quarter. While this was up seasonally adjusted from the first quarter, it was 3.0 percent below the borrowing in the second quarter of 2017. HELOC borrowing alone was at an estimated $42 billion, and while up by 20 percent from the first quarter, which Black Knight calls a typical seasonal pattern, was a 4.0 percent decline year-over-year. Cash-out refinances did decline quarter-over-quarter by 14 percent to $25.6 billion, the lowest quarterly total in two years.
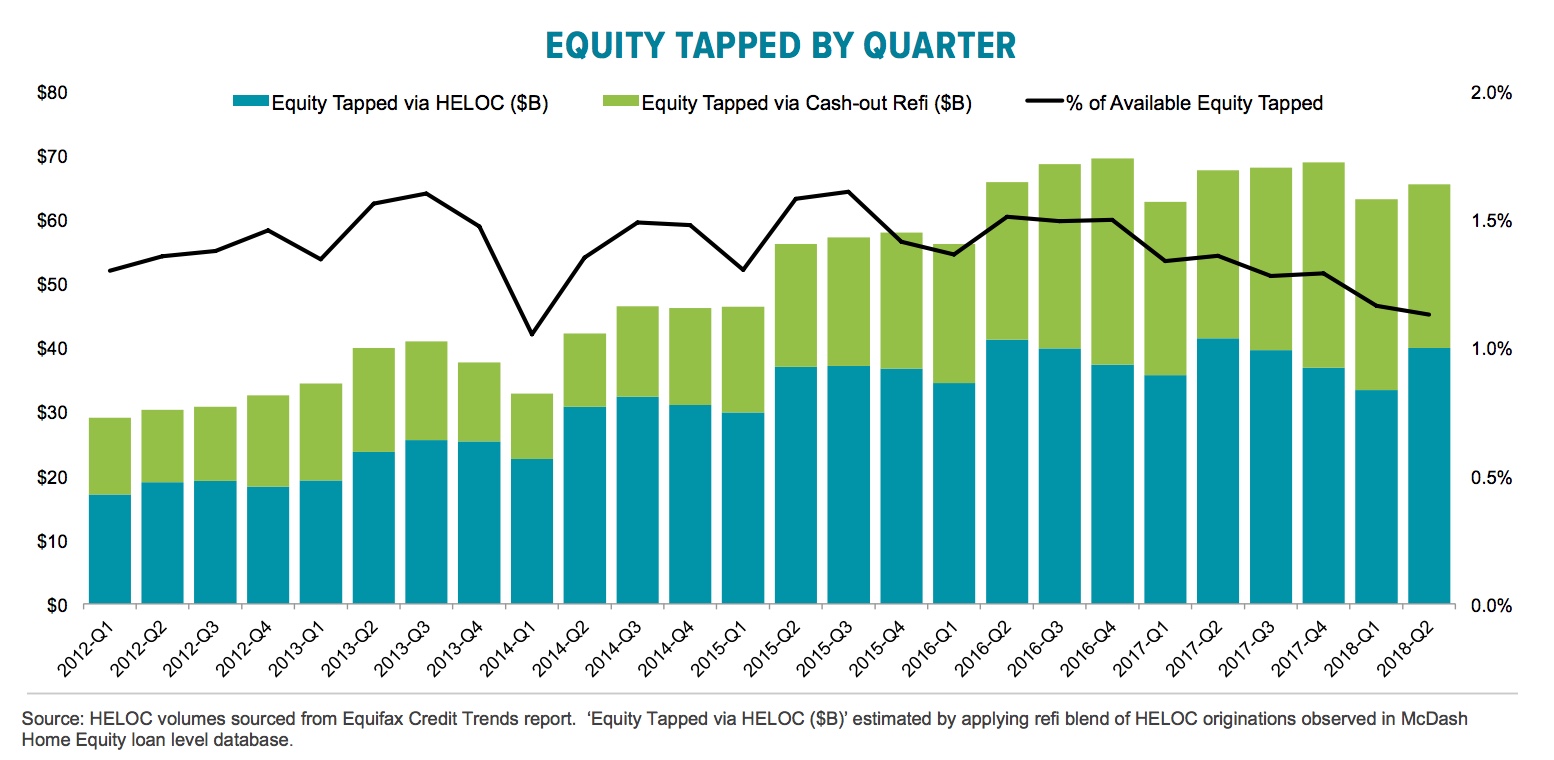
The company states it may be rising interest rates that are suppressing borrowing. Ben Graboske, executive vice president of Black Knight's Data & Analytics division said, "July's data also suggested that rising interest rates continue to negatively impact home equity utilization. While the $65 billion in equity withdrawn via cash-out refinances or HELOCs was a seasonally expected increase from Q1 2018, this was down by more than three percent from the same period last year. At just 1.13 percent, it was also the lowest share of available equity withdrawn since Q1 2014; another period of rising rates. From Q1 to Q2 2018, the average interest rate on 30-year mortgages increased by more than 0.25 percent, while the average rate on a HELOC increased by 0.30 percent. At this time last year, 1.36 percent of available equity was being tapped. This suggests that rising interest rates may be suppressing home equity utilization by approximately 17 percent, resulting in homeowners tapping into $13 billion less equity than they may have otherwise."


