
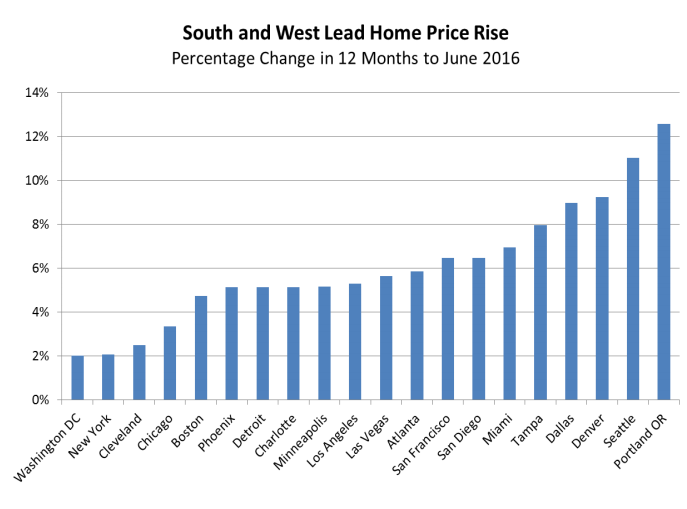
Results are in for the final two of the four major home price indices for June. Both the S&P CoreLogic Case-Shiller Indices and Black Knight Financial Services' Home Price Index (HPI) show continued price appreciation throughout the country with Case-Shiller reporting the appreciation tended to be greatest in two regions, the South and the West.
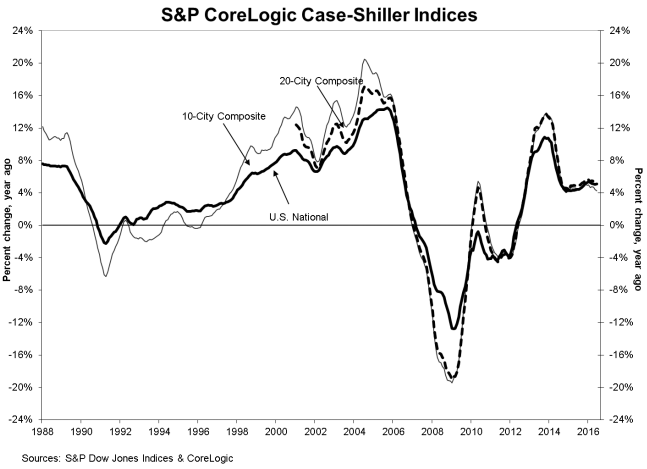
Case-Shiller's U.S. National Home Price Index, which covers the nine U.S. census divisions, was up 5.1 percent compared to June 2015, the same year-over-year increase that was posted in May. The non-seasonally adjusted national index posted a month-over-month gain of 1.0 percent and was up 0.2 percent after adjustment.
Both the 10-City and the 20-City Composite Indices were up from the May level by 0.8 percent on a non-seasonally adjusted basis and each eked out an 0.1 percent gain when adjusted. On a year-over-year basis the 10-City rose 4.3 percent, 0.1 percent less than in May, while the 20-City had a gain of 5.1 percent, down from 5.3 percent increase from May 2015 to May 2016.
As has been true for months, the highest annual gains among the 20 cities were in Portland, Oregon, which saw a 12.6 percent increase, Seattle, up 11.0 percent, and Denver with a 9.2 percent increases. Dallas and Tampa rounded out the top five with increases of 8.9 percent and 7.9 percent respectively. All 20 cities in the composites were in positive territory for the year ended in June and six cities reported greater price increases than for the year that ended in May.
In his analysis, David M. Blitzer, Managing Director and Chairman of the Index Committee at S&P Dow Jones Indices, pointed out that the continued increase in home prices was not uniform across the nation. "In the strongest region, the Pacific Northwest," he said, "prices are rising at more than 10 percent; in the slower Northeast prices are climbing a bit faster than inflation. Nationally, home prices have risen at a consistent 4.8 percent annual pace over the last two years without showing any signs of slowing.
"Overall, residential real estate and housing is in good shape," Blitzer continued. "Sales of existing homes are at running at about 5.5 million units annually with inventory levels under five months, indicating a fairly tight market. Sales of new single family homes were at a 654,000 seasonally adjusted annual rate in July, the highest rate since November 2007. Housing starts in July topped an annual rate of 1.2 million units. While the real estate sector and consumer spending are contributing to economic growth, business capital spending continues to show weakness."
Black Knight reported its HPI stood at $265,000 in June. That was an increase of 0.8 percent from May and a year-over year increase of 5.3 percent. The index is now up 32.5 percent from the bottom it reached in 2012 and within 1.1 percent of its pre-crash peak.
The company also reports major price gains in Portland, Seattle, and Denver with each up more than 9 percent in the first half of 2016. However, the greatest June increases among the states were in Michigan and Wisconsin with 1.6 and 1.5 percent growth respectively compared to May. At the other extreme, San Jose backed off of its May 2016 peak, as prices dipped 0.3 percent, making it one of only two metros (along with Naples, FL) to see negative monthly movement.
Home prices in six of the nation's 20 largest states and 14 of the 40 largest metros hit new peaks on Black Knight's index in June.
The S&P CoreLogic Case-Shiller Home Price Indices are constructed to accurately track the price path of typical single-family home pairs for thousands of individual houses from the available universe of arms-length sales data. The National U.S. Home Price Index tracks the value of single-family housing within the United States. The indices have a base value of 100 in January 2000; thus, for example, a current index value of 150 translates to a 50 percent appreciation rate since January 2000 for a typical home located within the subject market.
The Case-Shiller National Index peaked at 184.62 in July 2006 and fell to 134.01 at its trough in February 2012. Since then it has recovered by 36.1 percent and is now at 182.42, within 1.2 percent of its high. As of June 2016, average home prices for the MSAs within the 10-City and 20-City Composites are back to their winter 2007 levels but both indices remain in excess of 8 percent below their peaks.
Black Knight basis its Home Price Index (HPI) report on the appropriate month's residential real estate transactions. It utilizes repeat sales data from the nation's largest public records data set, as well as its own loan-level mortgage performance data, to produce measures of home prices for both disclosure and non-disclosure states.


