
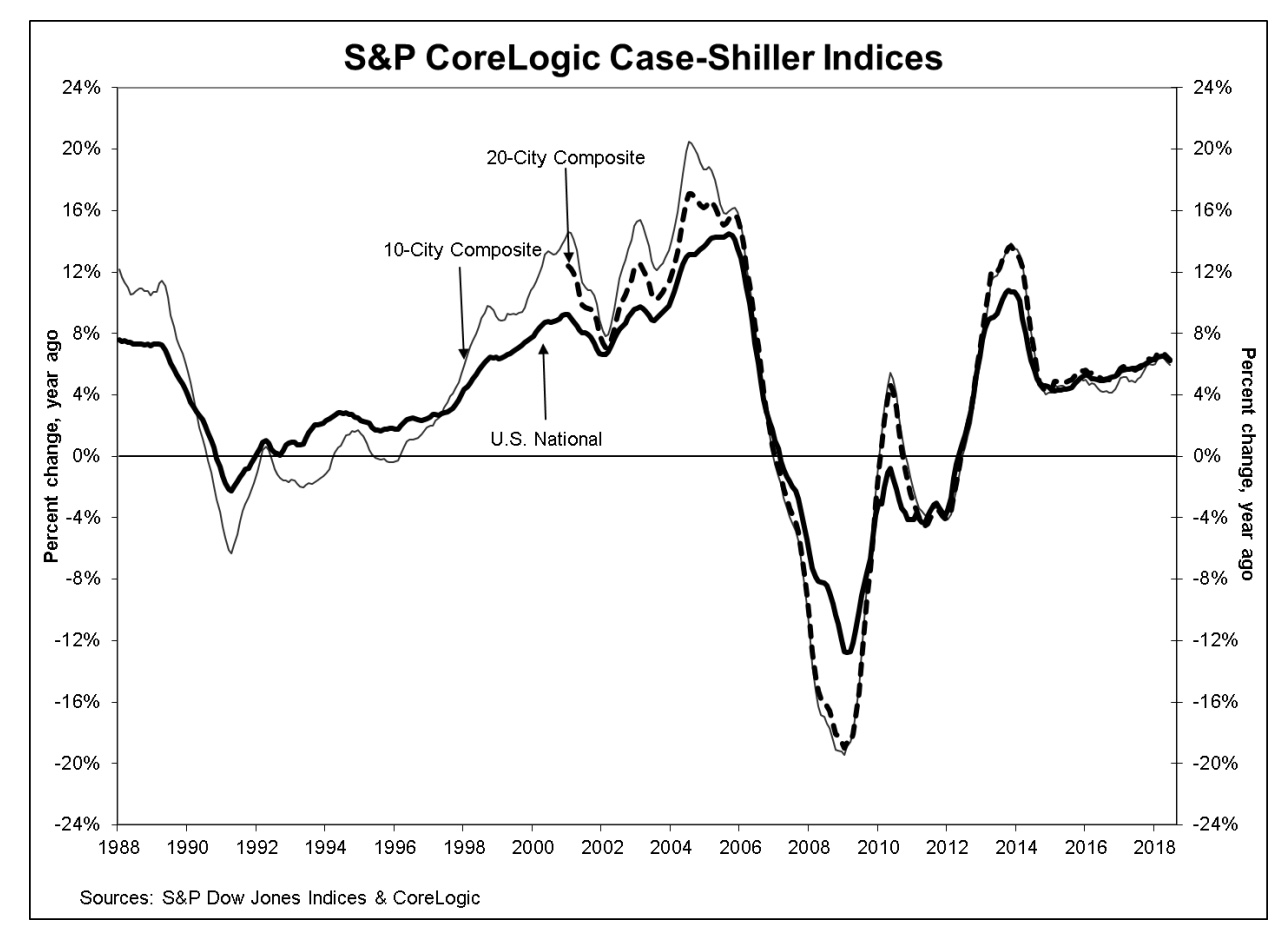
Prices slipped in June according to the S&P CoreLogic Case-Shiller price indices. The National Index, which covers all nine U.S. Census divisions, showed annual prices were up by 6.4 percent in both April and May but posted only a 6.2 percent increase in June. The month-over-month change was also less aggressive. Before seasonal adjustment that index was up 0.8 percent for the month and 0.3 percent after adjustment. The May gains were 1.1 percent before adjustment and 0.4 percent afterward.
The 10-City Composite grew by 6.0 percent year-over-year, down from 6.2 percent the previous month and the 20-City Composite increased by 6.3 percent compared to 6.5 percent in May. On a non-adjusted basis, the two posted monthly changes of 0.4 percent and 0.5 percent respectively and each gained 0.1 percent on an adjusted basis. Nineteen of 20 cities reported increases in June before adjustment and 17 of 20 cities reported increases after.
Econoday polls its panel of analysts on expectations for the 20-City Composite and their consensuses overshot the mark. They forecast a seasonally adjusted monthly increase of 0.2 percent and an annual gain of 6.5 percent.
Las Vegas, Seattle and San Francisco continued to report the highest year-over-year gains among the 20 cities. In June, Las Vegas was up by 13.0 percent, with Seattle following closely at 12.8 percent. Prices were higher in San Francisco by 10.7 percent. Six of the 20 cities reported greater price increases in the year ending June 2018 versus the year ending May 2018.
David M. Blitzer, Managing Director and Chairman of the Index Committee at S&P Dow Jones Indices said, "Home prices continue to rise across the U.S. However, even as home prices keep climbing, we are seeing signs that growth is easing in the housing market. Sales of both new and existing homes are roughly flat over the last six months amidst news stories of an increase in the number of homes for sale in some markets. Rising mortgage rates - 30 year fixed rate mortgages rose from 4 percent to 4.5 percent since January - and the rise in home prices are affecting housing affordability.
"The west still leads the rise in home prices with Las Vegas displacing Seattle as the market with the fastest price increase. Population and employment growth often drive homes prices. Las Vegas is among the fastest growing U.S. cities based on both employment and population, with its unemployment rate dropping below the national average in the last year. The northeast and mid-west are seeing smaller home price increases. Washington, Chicago and New York City showed the three slowest annual price gains among the 20 cities covered."
The National Index is now up 10.8 percent from its previous peak in July of 2006 while average prices for homes in cities covered by the 10-City and 20-City indices have recovered to their winter 2007 levels. The indices themselves are now both fully recovered from the housing crash; the 20-City is up 3.2 percent from the prior peak and the 10-City pulled even in June with its 2006 benchmark.
The S&P CoreLogic Case-Shiller Home Price Indices are constructed to accurately track the price path of typical single-family home pairs for thousands of individual houses from the available universe of arms-length sales data. The National U.S. Home Price Index tracks the value of single-family housing within the United States. The indices have a base value of 100 in January 2000; thus, for example, a current index value of 150 translates to a 50 percent appreciation rate since January 2000 for a typical home located within the subject market.
The National Index set another new record high in June of 204.48, up from the previous month's peak of 202.95. The 10- and 20-City Composites had readings of 226.36 and 213.07 respectively. Los Angeles claims the highest index reading at 282.91. Cleveland had the lowest reading at 121.93.


