A recent entry in the Liberty Street Economics blog of the Federal Reserve Bank of New York (FYBNY), compared the recent decline in Treasury yields to those of earlier sell-offs, focusing specifically on the historical composition of the Fed's System Open Market Account (SOMA) which, in recent years, has been used to implement monetary policy. Fed actions with regard to SOMA have been intended to promote the Federal Open Market Committee's (FOMC) dual mandate to foster employment and price stability.
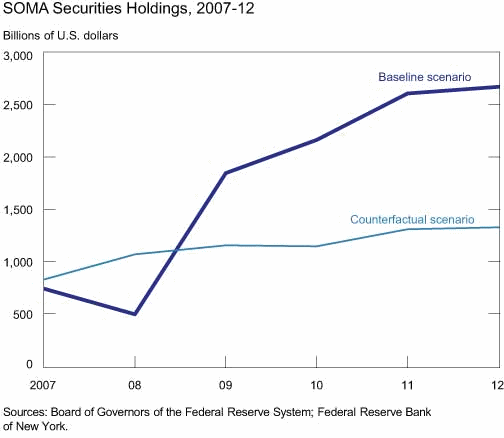
Specifically the FOMC exponentially increased the size of the SOMA portfolio (from around $500 billion in 2008 to about 2.7 trillion in 2012) and shifted its composition from Treasury bills and Treasury coupons to large holdings of Treasury coupons and mortgage-backed securities and lesser levels of agency debt. The Fed purchased these longer-term assets to reduce private sector holdings of such assets and thus reduce term premia and long-term interest rates.
This policy also generated high levels of portfolio income and increased revenue to the U.S. Treasury. Deborah Leonard, Assistant Vice President, Julie Remache, Vice President, and Grant Long, Association, all in the FYBNY's Markets Group and Michael Fleming, Vice President, Research and Statistics Group, authors of "What If? A Counterfactual SOMA Portfolio" on the blog forecast a net decline in that income as monetary policy is normalized. Net income may even dip below pre-crisis averages for a time, they say, and remittances to the Treasury could be suspended.
The four ask what the path of the portfolio and the income it generated might have been had the FOMC not taken the unconventional balance sheet actions. They conducted a "counterfactual" exercise to explore such a scenario and answer their own question.
The exercise is based on the assumption that the Fed's response to the financial crisis was solely to reduce the federal funds target rate. Thus the counterfactual SOMA portfolio post 2007 remained all-Treasury growing roughly in line with the currency in circulation. They then compared their constructed reality to actual balance sheet developments based on the FRBNY report Domestic Open Market Operations during 2012, a projected portfolio path based on primary dealer expectations from the Desk's Survey of Primary Dealers, and to the exit strategy principles from June 2011 FOMC minutes. These reality-based assumptions are called the "baseline" scenario.
To simplify the exercise and because of the difficulty of projecting what would actually have happened the authors assumed that interest rates followed the same path for both scenarios. In fact long term interest rates might have been higher or lower in the absence of the Fed's unconventional monetary policy.
At the end of 2012, SOMA domestic securities holdings would have consisted of roughly $1.3 trillion in Treasury securities in the counterfactual scenario compared to the $2.7 trillion in Treasuries, agency debt, and agency MBS SOMA actually held. The first portfolio would have had a weighted average maturity (WAM) of 5.4 years at the end of 2012, similar to the WAM of the outstanding supply of Treasury securities. The baseline portfolio of Treasury holding had a WAM of 10.4 years.

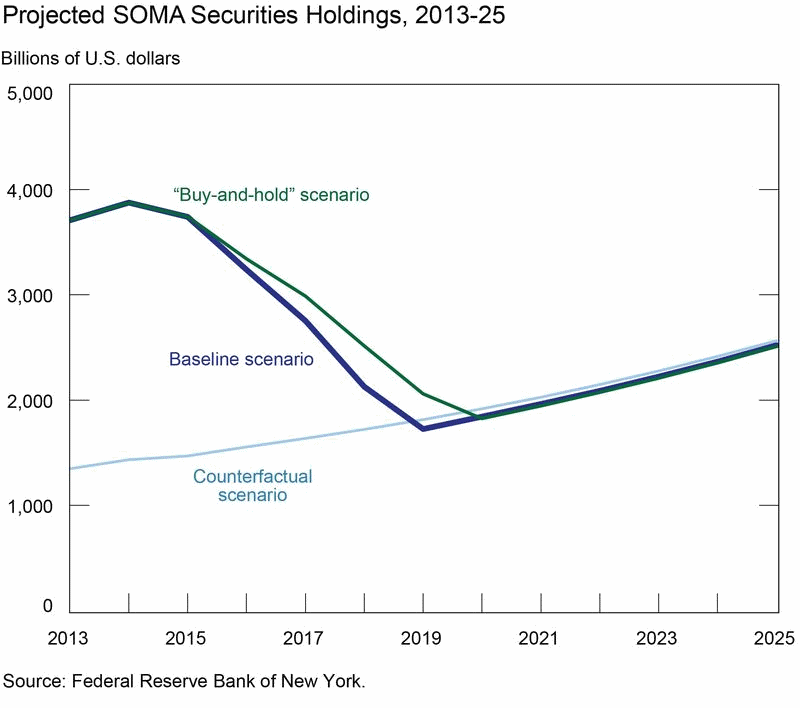
The counterfactual portfolio would have continued to grow
steadily as currency grew through the end of the exercise horizon in 2025. The baseline portfolio is projected to vary
from a peak of nearly $3.9 trillion in early 2014 as the presumed asset
purchases end, then remain elevated through early 2015. A combination of redemptions and assets sales
(as envisioned from the FOMC's 2011 exit strategy principles*) would shrink the
portfolio steadily during the policy normalization period. The sizes of the two portfolios would roughly
converge in 2019.
Although the baseline portfolio returns to a nearly all-Treasury composition in
2021, the composition of its securities holdings still has a slightly higher
WAM than the counterfactual portfolio because of the longer-term Treasury
securities that were purchased in recent years

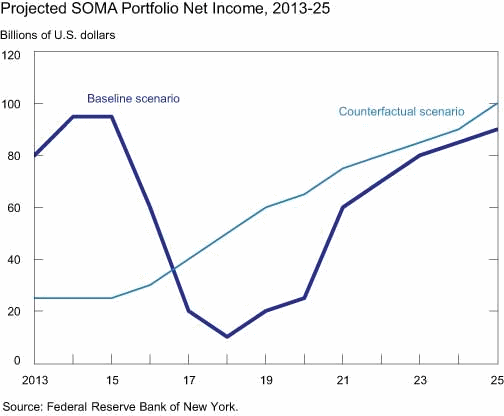
The authors estimate that the net income generated by its counterfactual portfolio would remain relatively steady at an average of about $27 billion from 2008 to 2012, reflecting both the short maturities and the small size of the portfolio. The baseline portfolio rises steadily during the period, peaking at almost $90 billion in 2012.

But, under the assumptions for the baseline scenario, net income will begin to fall in 2016 and remain low for several years. This reflects several factors including higher interest payments on excess reserve balances as rates rise, declining interest income as the portfolio shrinks, and realized capital losses as agency MBS are sold.

In contrast, net income from the counterfactual portfolio is projected to grow as policy is normalized. The portfolio, heavily invested in short-term Treasury securities, will roll those holdings over in an environment of rising rates. Moreover, because the portfolio is funded primarily with currency it has only minimal interest expense associated with reserves. The income from the two portfolios is forecast to converge late in the projection period by which time the baseline would be in a steady state, holding predominately Treasury securities and its size once again roughly matching currency.
The income the Fed generates, minus operating costs, dividends, and capital maintenance, is remitted to Treasury and these remittances have been elevated since the crisis to a cumulative $325 billion from the end of 2007. This is roughly $240 billion above the estimated $85 billion from the counterfactual scenario. This difference exists despite higher interest costs from funding the larger portfolio with excess reserves.
Should the Fed not generate sufficient income to cover those above referenced expenses in future years, it would book a deferred asset and temporarily halt Treasury remittances. The deferred asset would have to be paid down before remittances could resume. The projected declines in income in the baseline portfolio suggest such a scenario for several years while the counterfactual scenario, with a steadier projected path, would avoid that outcome. Nonetheless the baseline is projected to remit a cumulative $820 billion to Treasury through 2025, $315 billion more than the counterfactual scenario. This arises from its higher overall income even if the timing of remittances is less smooth than that of the counterfactual example.
The authors admit their estimates of counterfactual income and remittances are necessarily rough and depend on various assumptions, especially the unrealistic one that interest rates would have been the same under each scenario. Moreover, when considering the net effects of monetary policy on the government's fiscal position, one should also account for the lower borrowing costs and support for the economic recovery the Fed's actions have produced. Nonetheless, they say their findings broadly highlight the effect of unconventional monetary policy of cumulative Treasury remittances.
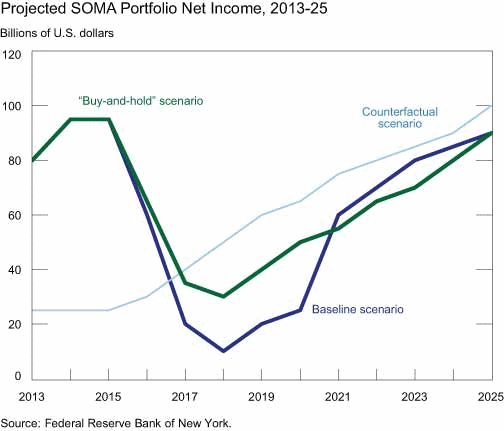
*In an addendum to the article the authors look at the June 2013 FOMC minutes which appear to portend that the Fed might not sell agency MBS as part of the normalization process although it might reduce or eliminate residual holdings. A sell off was anticipated in the above analysis based on the FMOC's June 2011 exit strategies. The Domestic Open Market Operations report used in part to generate the baseline considered an alternative "buy-and-hold" scenario that illustrates how the baseline balance sheet and income projections change in the case of no asset sales.
Under the later assumption the general contours of the portfolio's size and income are projected to follow similar overall paths as the baseline. However, the buy-and-hold portfolio is expected to take slightly longer to converge in size with the counterfactual portfolio, at which time its size once again roughly matches currency levels. Importantly, its composition includes significant holdings of both agency MBS and Treasury securities. A buy-and-hold scenario avoids capital losses on agency MBS sales but has higher interest expense from additional reserve balances associated with a larger portfolio, on net resulting in higher portfolio net income over the medium term compared to the baseline and leading to roughly $55 billion cumulatively in additional remittances to the Treasury. These are, of course, merely projections and actual income and remittances will be influenced by the ultimate size of the purchase program, as well as other balance sheet, interest rate, and economic developments.


