
Both the Federal Housing Finance Agency's (FHFA's) Housing Price Index (HPI) and the several S&P CoreLogic Case-Shiller indices showed price gains across the U.S. in June. Case-Shiller's numbers showed more moderation in the rate of increase than did those from FHFA.
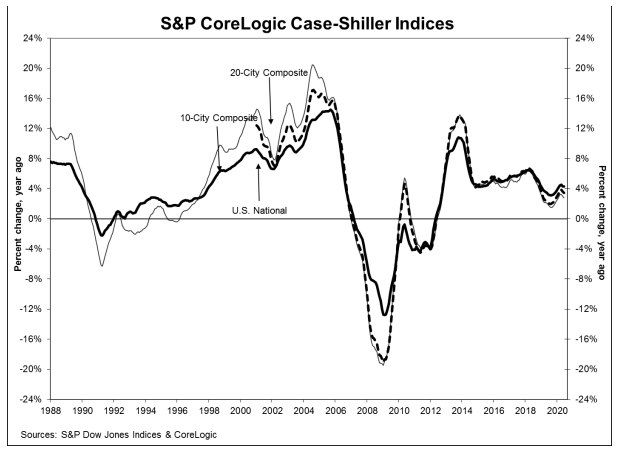
The Case-Shiller's National Home Price Index, covering all nine U.S. census divisions, was up 4.3 percent for the 12 months ended in June, the same annual increase as was posted in May. Prices rose 0.2 percent month-over-month on a seasonally adjusted basis (SA) and were 0.6 percent higher before adjustment (NSA).
The 10-City Composite annual increase came in at 2.8 percent, down from 3.0 percent the previous month while the 20-City Composite gain was 3.5 percent compared to 3.6 percent in May. The 10 and 20-City Composites had NSA increases of 0.1 percent and 0.2 percent, respectively. After seasonal adjusted the 10-City dipped 0.1 percent and the 20-City index was unchanged. In June, 16 of 19 cities (data remains unavailable from Detroit because of COVID-19 related shutdowns) reported increases before seasonal adjustment, while 12 of the 19 cities reported NSA gains.
Phoenix, Seattle, and Tampa still lead the nation in price gains. Phoenix had an annual increase of 9.0 percent followed by Seattle and Tampa, up 6.5 percent and 5.9 percent, respectively. Five of the 19 cities reported higher price increases in the year ending June 2020 versus the year ending May 2020.
Craig J Lazzara, Managing Director and Global Head of Index Investment Strategy at S&P Dow Jones Indices, provided the following commentary on the June data.
"Housing prices were stable in June. "The National Composite Index rose by 4.3 percent in June 2020, as it had also done in May (June's growth was slightly lower in the 10- and 20-City Composites, which were up 2.8 percent and 3.5 percent, respectively). More data will be required to understand whether the market resumes its previous path of accelerating prices, continues to decelerate, or remains stable. That said, it's important to bear in mind that deceleration is quite different from an environment in which prices actually fall.
"June's gains were quite broad-based. Prices increased in all 19 cities for which we have data, accelerating in five of them. Phoenix retains the top spot for the 13th consecutive month, with a gain of 9.0 percent for June. Home prices in Seattle rose by 6.5 percent, followed by Tampa at 5.9 percent and Charlotte at 5.7 percent. As has been the case for the last several months, prices were particularly strong in the Southeast and West, and comparatively weak in the Midwest and (especially) Northeast."
FHFA reported a 5.4 percent increase from the second quarter of 2019 to the end of that quarter in 2020. Prices rose 0.9 percent during the month of June and 0.85 percent for the quarter as a whole, reflecting earlier impacts from the pandemic.
FHFA's HMI has risen in every quarter since September 2011, a total of 36 consecutive increases. Prices were up in all 50 states and the District of Columbia between the second quarters of 2019 and 2020. Idaho led with a 10.8 percent increase followed by Arizona at 9.1 percent, Washington State, 8.6 percent, Utah 8.1 percent and New Mexico 7.7 percent. Idaho has posted the highest gains for the last seven quarters.
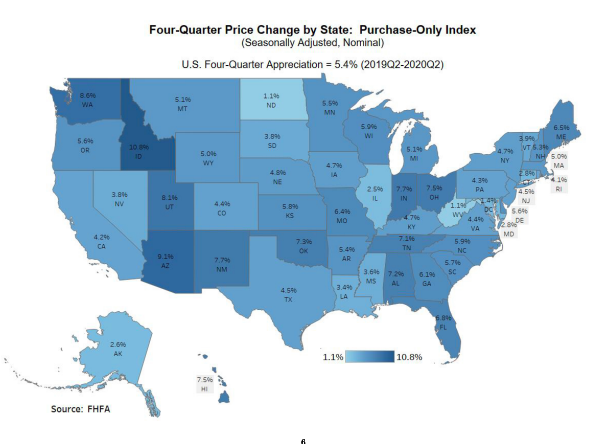
Prices were also higher in 99 of the top 100 largest metropolitan areas over the last four quarters, led by Urban Honolulu, at 11.7 percent. Prices were weakest in the San Francisco metro area where they declined 0.3 percent.
Among the nine census divisions, the strongest four quarter appreciation was in the Mountain division which has led for 11 quarters, this time posting a 7.0 percent gain. Annual house price appreciation was weakest in the Middle Atlantic division, where prices rose by 4.5 percent between the second quarters of 2019 and 2020.
"Home prices grew by 5.4 percent in the second quarter of 2020 compared to a year ago, despite the impacts of COVID-19." said Dr. Lynn Fisher, Deputy Director of the Division of Research and Statistics at FHFA. "Although house prices fell slightly in May relative to April, in June prices rebounded by 0.9 percent over the month as local economies re-opened and transactions picked up again. Four Census Divisions showed strong early summer gains with month over month growth of one percent or more in June."
FHFA's HMI reflects the prices of homes purchased using financing provided by either Fannie Mae or Freddie Mac. The index was benchmarked at 100 in January 1991 and was at 289.9 at the end of June.
The S&P CoreLogic Case-Shiller Home Price Indices are constructed to accurately track the price path of typical single-family home pairs for thousands of individual houses from the available universe of arms-length sales data. The National U.S. Home Price Index tracks the value of single-family housing within the United States. The indices have a base value of 100 in January 2000; thus, for example, a current index value of 150 translates to a 50 percent appreciation rate since January 2000 for a typical home located within the subject market.
As of May 2020, the National Index was at 219.82 compared to 218.87 in May. The 10- and 20-City Composites had readings of 236.94 and 225.13 compared to 236.98 and 224.76 the previous month. Los Angeles has the highest index reading at 297.89 and Cleveland (absent data on Detroit) the lowest at 132.71.


