Among the charts and tests summarizing most of the housing finance news that emerged during July, the latest issue of the Urban Institute's (UI's) Housing Finance Chartbook contained a few unique visualizations.
First, loans featuring coverage by private market insurers (PMI) surpassed the market share of loans insured by FHA for the first time in two years. This switch is apparently due to the April adjustment of PMI premiums, which dropped the cost for low risk borrowers and raised them for those with a higher credit risk profile. There has probably also been some impact on the distribution from some larger lenders who have focused on marketing the lower down payment opportunities offered through new GSE products.
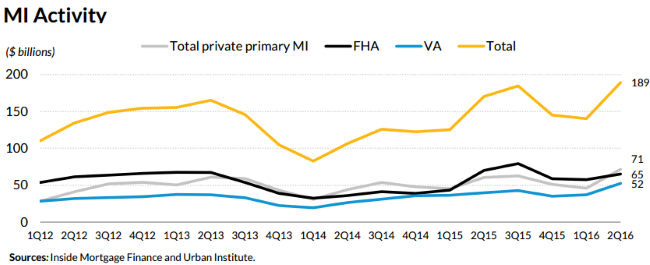
Whatever the reasons, the PMI industry's share of originations increased from 33 percent in Q1 to 38 percent in the second quarter while FHA's share declined from 41 to 34 percent. The PMI volume of originations increased by 56 percent to $72 billion, the highest quarterly volume since the first quarter of 2008.
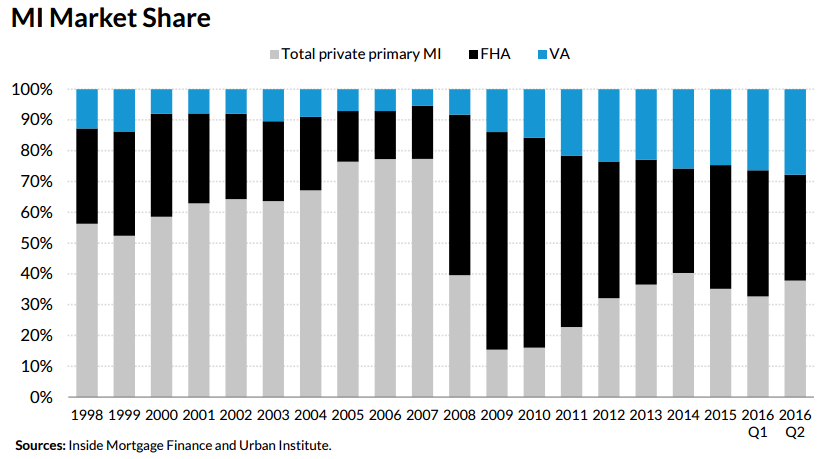
UI says this restores the FHA/PMI market share to 2014 levels, before FHA reduced its upfront mortgage insurance premiums by 50 basis points. This drove a jump in the agency's market share from 34 percent in 2015 to 40 percent the following year while the PMI share dropped from 40 to 35 percent. The report says if the shift back to PMI takes away a significant part of FHA's lower credit risk business it could put pressure on FHA's balance sheet, possibly pushing the agency to lure higher quality business back with another premium cut.
While the shares of the mortgage insurance market shifted, the total volume mortgages insured by all sources, VA, FHA, and private insurers also increased during Q2, rising to $189 billion from $140.2 billion in Q1 and up 11 percent from a year earlier.
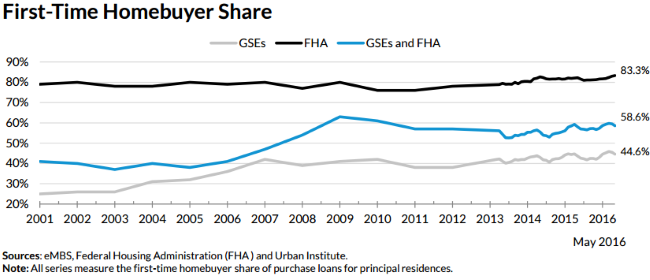
UI puts the first-time homebuyer share of mortgages originations at 58.6% in May, much higher than the share attributed to first timers by the National Association of Realtors (NAR) which has hovered in the low 30 percent range and below for several years. (UI has said in the past it finds the NAR formula for computing this share to be flawed.) FHA garnered 83.3 percent of that market, an increase from its usual share that hovers around 80 percent. The GSE share edged down to 44.6 percent.
The Chartbook also makes some comparisons between first-time homebuyers and repeat buyers and finds that repeat buyers take out larger loans ($252,837 versus $207,451), have higher credit scores (741 to 712) lower loan to value ratios (by 8 percentage points), debt-to-income ratios that average 1 point lower, and not surprisingly, get better interest rates. GSE borrowers, both repeat and first-timers, score better on all credit factors than their counterparts getting FHA loans, but the FHA borrowers get slightly better interest rates.
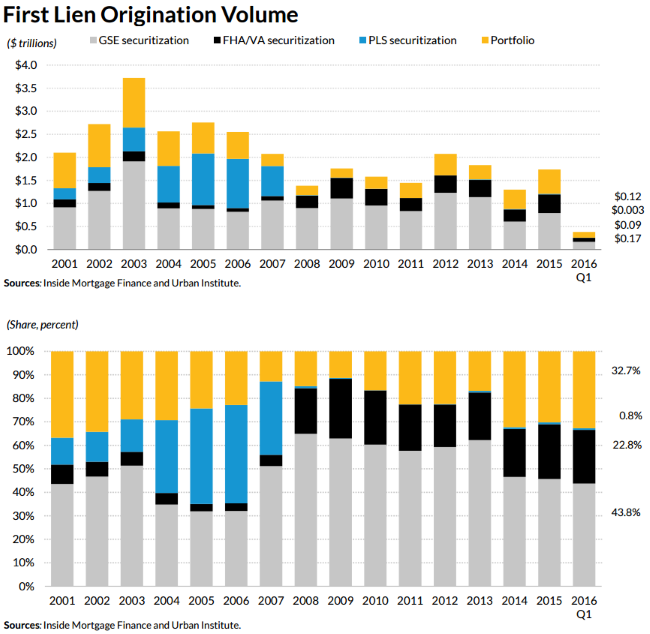
Finally, 1st quarter 2016 originations totaled approximately $380 billion. The share of portfolio originations rose to 33 percent, UI said because credit risk is so benign that, with the relatively high g-fees, banks are willing to hold more of the risk. The GSE share eased back to 44 percent from 46 percent in 2015, FHA/VA originations accounted for 23 percent and the private label share remained negligible at 0.8 percent