The Federal Housing Finance Agency (FHFA) has released its seasonally adjusted purchase-only house price index (HPI) for the second quarter of 2011 and for the fourth consecutive quarter it reports that those prices declined nationwide. The HPI measures prices recorded for repeat home sales using Freddie Mac or Fannie Mae mortgages. During the period which ended June 30 there was a deterioration of national home prices of 0.62 percent. During June, the last month in the current reporting period, however the HPI did rise 0.9 percent. Over the last four reporting periods the HPI has dropped 5.9 percent and, at the end of June was down 18.8 percent from the price peak reached in April 2007. A second index, the all-transactions HPI which includes refinancing as well as purchases, decreased 1.9 percent in the second quarter and is down 4.5 percent over the last year.
The four-quarter decline in home prices over the last four quarters stands in contrast to the prices of other goods and services which rose 4.5 percent during the same period resulting in an inflation-adjusted change in the price of purchased homes of -10 percent in one year.
The seasonally adjusted purchase-only HPI declined from the first quarter to the second quarter in 31 states and, over the last year, only three states have recorded any home price appreciation, Oklahoma (+0.28 percent), North Dakota (+3.87 percent) and the District of Columbia (+12.23 percent.) The largest price decrease over the last year was reported in Arizona (-14.91). Idaho, Georgia, Nevada, and Oregon all had one year negative price changes in the 13 to 14 percent range
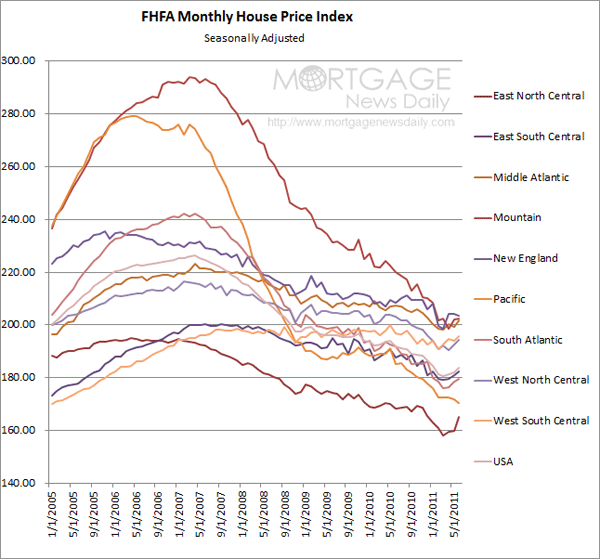
Of the nine census divisions, the New England and West South Central divisions experienced the strongest price gains in the latest quarter, with both posting 0.7 percent price increases. Prices were weakest in the Mountain census division, where prices fell 2.3 percent.
The HPI tracks average house price changes in repeat sales or refinancing of the same single family properties. The purchase only index covers more than 6 million repeat sales transactions while the all-transaction index covers 43 million repeat transactions.