
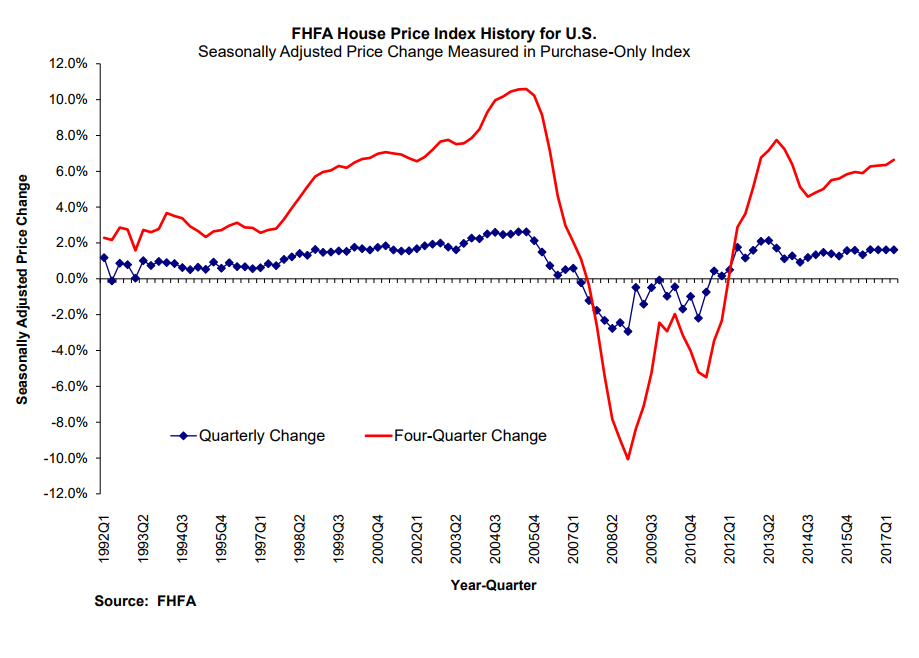
The Federal Housing Finance Agency (FHFA) reported on Tuesday that home prices were up in 48 states and the District of Columbia during the second quarter of 2017. The agency said that its Housing Price Index appreciated 1.6 percent compared to the first quarter of the year.
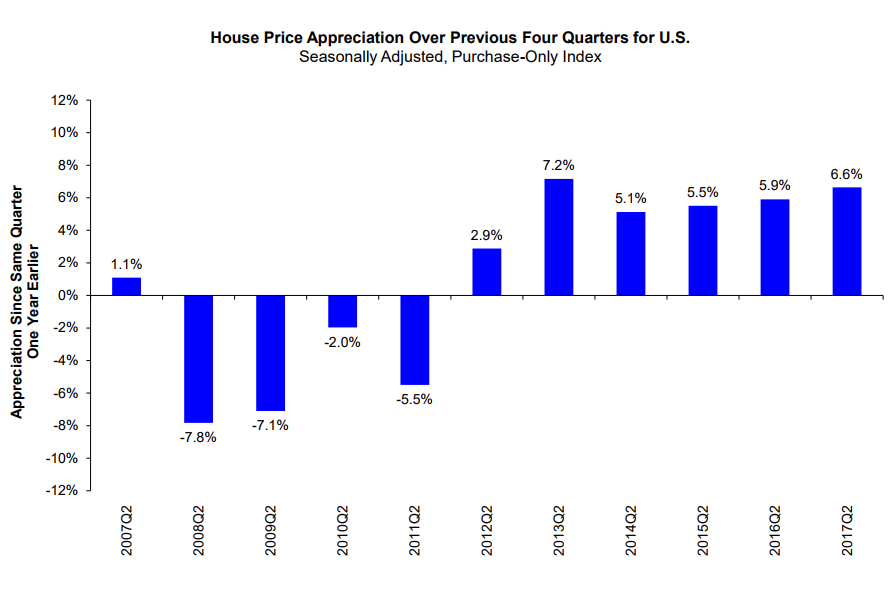
Year-over-year prices, expressed as an increase from the second quarter of 2016, was 6.6 percent. On a monthly basis, prices in June were 0.1 percent higher than in May. All of FHFA's national numbers marked deceleration from earlier reports. The year-over-year figure in May was 6.6 percent and May's prices rose 0.4 percent when compared with April.
The slowing of increases surprised analysts polled by Econoday. There were looking for even stronger monthly gains than in May, from 0.3 to 0.6 percent, with a consensus of 0.5 percent.
"U.S. house prices rose in most states during the second quarter," said FHFA Senior Economist William Doerner. "New home sales are climbing but, relative to the overall population, they still remain low from a historical perspective. The tight inventory is a major explanation for why house prices have been increasing every quarter over the last six years."
The states with the greatest price gains from the second quarter of 2016 to the same quarter in 2017 were Washington at 12.4 percent; Colorado 10.4 percent; Idaho 10.3 percent; Florida 9.4 percent; and Utah 9.2 percent. The two states that experienced year-over-year price declines were West Virginia where prices were down 1.22 percent and Alaska where they fell 0.33 percent.
The Pacific division experienced the strongest increase among the nine census divisions, posting a 2.6 percent quarterly gain, 8.9 percent since the second quarter of last year. House price appreciation was weakest in the Middle Atlantic division, where prices rose 0.8 percent from the last quarter. The year-over-year gain in the division was 4.08 percent.
FHFA's HPI tracks changes in average home prices by analyzing changes in home values from Fannie Mae- and Freddie Mac-purchased and guaranteed mortgages originated over the past 42 years. The index has a base value of January, 1991=100 and was at 249.3 in June compared to 249.2 in May.


