Until the beginning of the housing bust, distressed sales were only a small part of the market and were discounted only in a modest and relatively stable manner therefore there was limited demand for price measures that were free of the influence of distressed home sales. These home price measures are usually based on observed data and are relied upon to identify trends in residential house values and thus to guide many real estate activities as well as government policy decisions so their accuracy is important. Given that distressed sales are known to be discounted significantly relevant to market transactions it would be reasonable to assume that these sales would have a significant impact on home price trends and that impact would depend on the number of distressed sales and the discount associated with each.
During the housing crisis the numbers of distressed sales, that is sales of bank-owned real estate (REO) and short sales increased substantially. The Federal Housing Finance Agency (FHFA) which publishes a regular index of home price trends, has been concerned about the impact of distressed home sales on the validity of its Home Price Index (HPI) and on the distress-free HPI it developed in the summer of 2012.
FHFA has now produced a Working Paper that evaluates distressed sales and studies their impact on the FHFA HPIs. The paper uses real estate transaction data from the state of Florida to determine to what extent distressed sales have influenced the measured house price trends, whether the methodology FHFA currently uses to identify and remove distressed sales from its "distress-free indexes is reliable, and how distressed sale discounts can be measured and tracked over time.
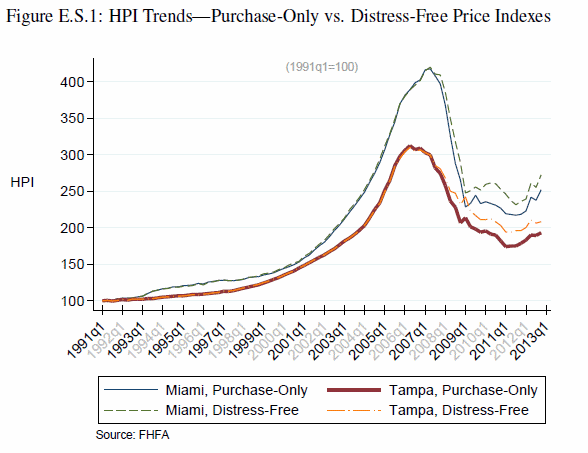
FHFA compared its standard house prices indexes which include distressed sales to its "distress-free" indexes for the Miami and Tampa markets and found that the distress-free HPIs had more modest price declines than the standard indexes during the early part of the housing bust - that is the presence of short and REO sales in the standard indexes exerted downward pressure on those measures. However, recently, as distressed sales were shrinking as a percentage of overall sales, the appreciation in the standard indexes was somewhat higher than in those that were distress-free.

There were data limitations on identifying distressed sales in earlier periods of housing down-cycles (that is the early 1990s) but the figure above clearly shows large differences between the standard and distress-free HPIs in recent years.
With the impact of distressed sales on measured price trends confirmed, FHFA set out to evaluate whether its approach to identifying distressed sales is reasonable. It is generally possible to identify with reasonable certainty from county recording data if a sale involved bank-owned property. Properly noting short sales, however, is more difficult.
FHFA checked its assumptions about a sale against a large set of historical property transactions in which county assessors made their own determinations as to whether a sale was distressed. In a significant proportion of the thousands of transactions checked there was concurrence between FHFA's inference as to whether a sale was distressed and that of the assessors office. For 25 to 35 percent of recent sales, however, no such concurrence existed.
In further examining those instances in which either the assessor or FHFA inferred distress and the other did not, the working paper found strong evidence that the FHFA methodology provides a reasonable indicated of distress. The evidence was the systematic difference in price appreciation. In cases where FHFA indicated a distressed sale and the assessor did not the average selling prices were found to be lower than would be expected for non-distressed transactions. Conversely where assessors assumed distress and FHFA did not, the average selling prices often were not substantially lower than would be expected and the small or nonexistent discounts suggested that many of these cases were not actually distressed sales.
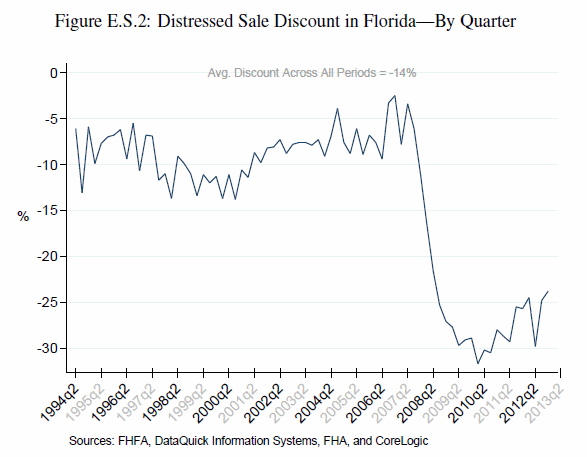
The Working Paper also looked at how discounts for distressed sales have varied over time in Florida. Across the roughly 20 years between 1994 and the present, the Working Paper estimated that the average price discount was about 14 percent but that it did vary significantly across years. In the late 1990s it tended to be around 10 to 15 percent but as the housing boom accelerated it shrank to between 5 and 10 percent or even lower. Then, in 2007 to 2010 it rose sharply to nearly 30 percent and moderated to about 25 percent by the first quarter of 2013.

Finally the paper describes a simple methodology for estimating the average discount during specific time periods, a minor adjustment to the basic house price model used for forming the FHFA House Price Index by attaching a dummy variable that allows the discount to fluctuate over time. FHFA says the approach is valuable because it is easy to implement and because time series information about distressed discounts is very difficult to find.
Although housing markets are strengthening, short sales and sales of bank-owned properties likely will continue to play a significant role in housing markets in the near future. The Working Paper's findings suggest that, although FHFA's methods and measures are still relatively new, they are founded on a reliable methodology. The analysis also indicates that price discounts associated with distressed sales can be easily measured. Using a newly-developed approach to measuring the trends, the paper shows significant variations over time in the magnitude of such discounts in the state of Florida.


