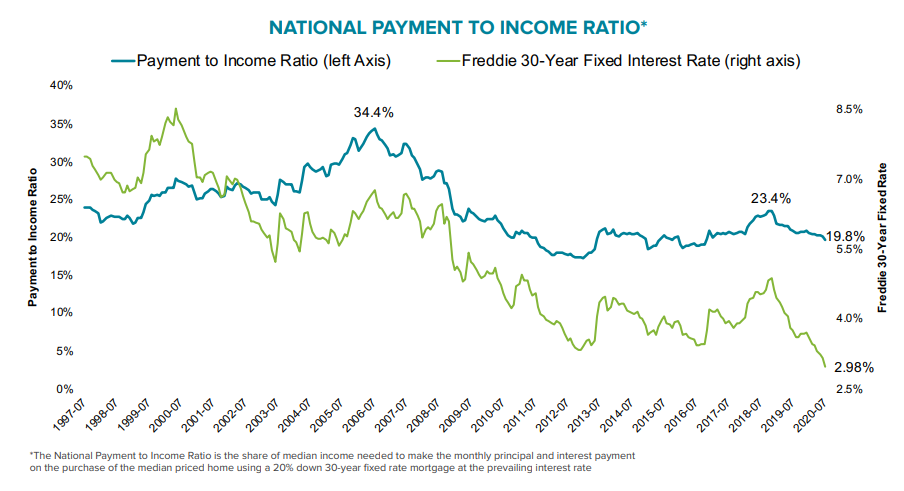
The last report from Freddie Mac put its 30-year fixed rate mortgage (FRM) at 2.99 percent, up 1 basis point from the all-time low. Black Knight, in its new Mortgage Monitor, says that has made home affordability the best in four years. As of mid-July, it required only 19.8 percent of the nation's median monthly income to make the mortgage payment on an average priced home using that 30-year FRM and a 20 percent down payment. That is more than 5 percent below the average over the 1995-2003 period. The required monthly payment, $1,071, is 6 percent less than last July despite an average $12,000 increase in home prices over that same period.
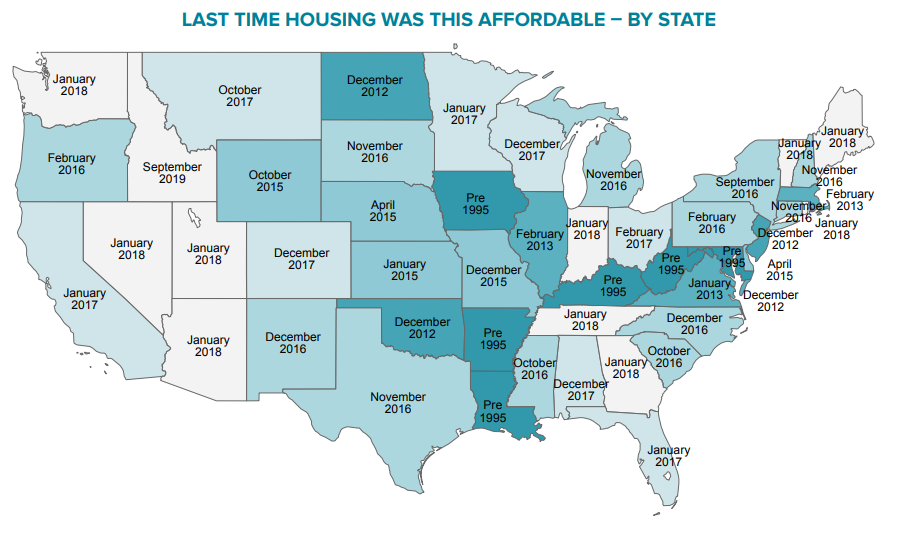
After 97 consecutive months, these record-low mortgage rate have made homeownership the most affordable it has been since 2016, and, while many areas, especially those along the coasts, remain out of reach for many low and middle-income earners, each of the 25 markets are seeing their strongest affordability in more than 2 years. Black Knight says, within the 100 largest markets several, including Virginia Beach, Hartford, and Scranton, have the strongest affordability levels in a decade and a half and six states, Louisiana, Arkansas, Iowa, West Virginia, Kentucky and Maryland, payment-to-income ratios are the lowest in more than 25 years.
Those shopping for a home can afford 10 percent more home than they could have one year ago while keeping their monthly payment unchanged. This translates into nearly $32,000 more buying power.
As Black Knight Data & Analytics President Ben Graboske explained, "Falling rates and improved affordability have helped to spur home-buying demand, and therefore purchase origination volume, which has provided a much-needed backstop for home prices in the wake of the COVID-19 pandemic."
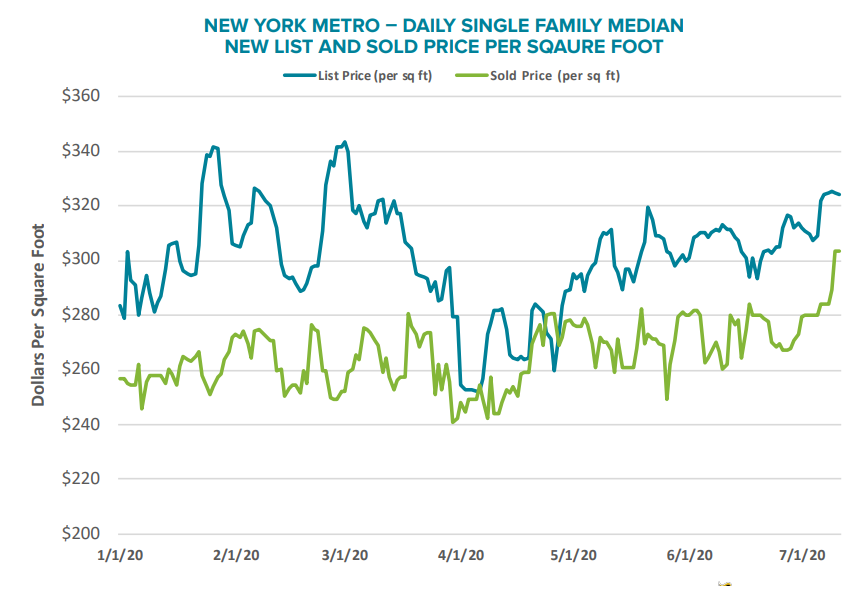
And, if New York is an indication, any price impacts from the epidemic could be short lived. Black Knight says, as the initial peak of the virus cases emerged in April, New York City was the epicenter and single-family list prices, which had averaged 5 percent higher than sale prices, began to fall. During the peak, median list prices ran even with, and even below the median sales prices. As affordability improved, the list prices in the metro area began to recover and were back to pre-pandemic levels. Sales prices soon followed suit, rising to new calendar year highs by mid-July.
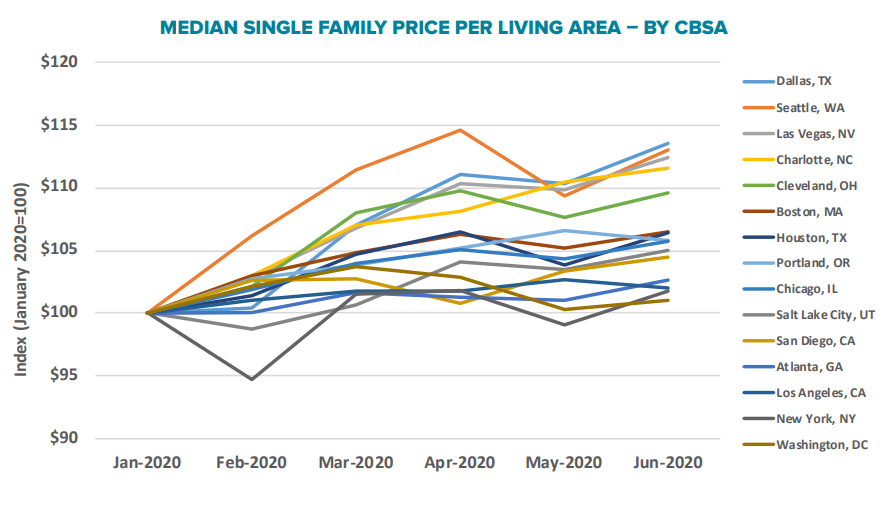
The company says daily home price data bears watching closely in coming months to measure the effects of the COVID-19 pandemic. Collateral Analytics looked at the price of homes per square foot of living area in 22 markets from January to June 1, 2020. It found that, despite price drops in April and May, prices have performed well and begun to improve in most markets. Each has now seen positive growth for the year to date. The strongest gains have been in Dallas and Seattle, both up more than 13 percent. The smallest gains were in Washington D.C. and New York at 1 percent and 1.8 percent, respectively.
Low interest rates are driving more than affordability. Both the pool of homeowners who could benefit from refinancing and prepayment rates (partially a product of refinancing) have been increasing.
That pool, homeowners who can qualify for to refinance and could erase a minimum of 75 basis points from their current mortgage by doing so, increased to 18.1 million when rates dropped below 3.0 percent in mid-July. A slight uptick in rates had reduced that number to 15.6 million at the time the Mortgage Monitor was written, but rates have again fallen below 3.0 percent. At present 52 percent of mortgage holders are "in the money" from a purely rate perspective.
Black Knight says those candidates could save an average of $289 per month with a refinance. That would be an aggregate savings (and economic stimulus) of $5.1 billion a month if all 17.8 million homeowners in the pool, (today's estimate of a constantly moving target) were to refi. If rates were to decline to 2.875, the pool would expand to 19.5 refinance candidates and another 10-basis points decline would bring it to 20.9 million.
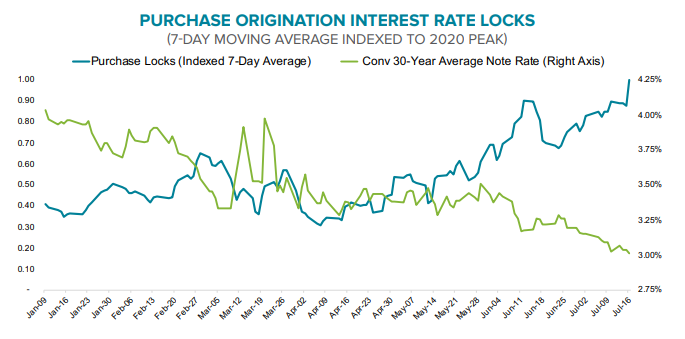
Refinance activity, measured via rate locks, grew modestly in July, rising only 2 percent from June and falling 10 percent from May. However, during the last three weeks of the month refinance rate locks were up 60 percent compared to the first week. In the meantime, purchase lending has surged. Purchase volumes fell by a third from March to April then stabilized at March levels the following month. However, in July, purchase locks are up 12 percent month-over-month and are 71 percent higher than the pre-pandemic level in March.
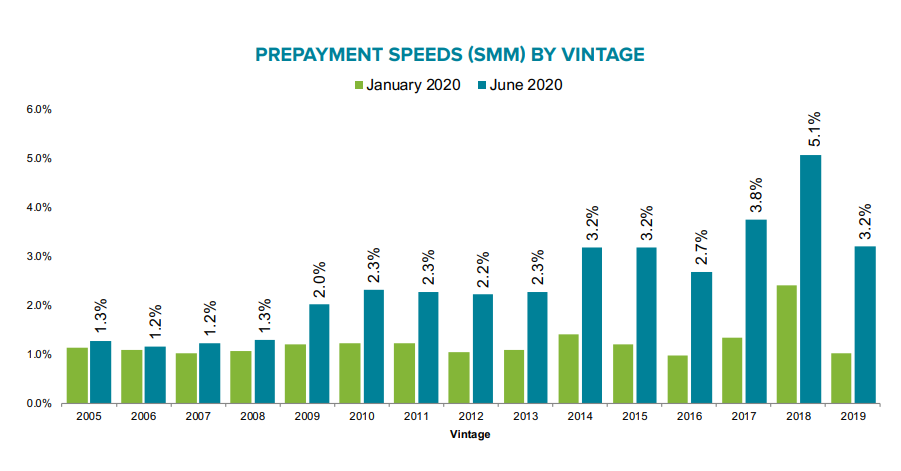
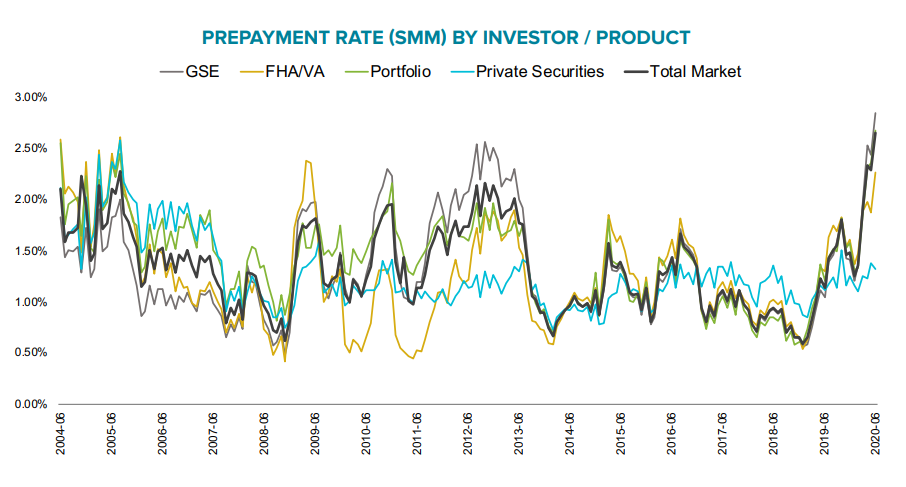
The single month mortality rate, a measure of mortgage pre-payments, now stands at nearly 3.0 percent and is up 111 percent since January. Prepayment of GSE loans (Fannie Mae and Freddie Mac) has risen 136 percent over that same period. The largest increase in June was among Ginnie Mae (FHA and VA) securitized loans which increased by 21 percent. Rates for both GSE and portfolio held mortgages are at their highest levels since 2004 while Ginnie Mae prepays are the highest since 2009.
Each of the past eight mortgage vintages have seen prepayment speeds more than double over the last five months and each of the most recent 11 vintages have seen at least a 65 percent increase. The 2019 vintage loan SMM rate is up 214 percent over that time frame. The highest speed, 5.1 percent, is among those loans originated in June 2018. That is the highest single month rate of any vintage since the Great Recession.