
A recent research paper from the Urban Institute (UI) looks at the benefits provided by real denial rates (RDR) over the traditional measure of credit availability, the observed mortgage denial rate (ODR). The authors, Laurie Goodman and Bing Bai from UI and Wei Li of the Federal Deposit Insurance Corporation (FDIC) maintain that the ODR can be misleading. Higher denial rates can result from either a tight credit environment or because of an increase in applications from less creditworthy buyers and can affect measures over time, across credit channels and for demographic groups.
Li and Goodman developed the RDR in 2014, and the current paper looks at five implications of their measure, updated with data through 2017.
- The ODR, which is based on Home Mortgage Disclosure Act (HMDA) data, understates the difficulty for borrowers with less-than-perfect credit to get a mortgage relative to the RDR.
- The RDR measure more accurately reflects credit accessibility across time.
- It more accurately reflects differences across channels, with the government channel showing a lower RDR than the conventional channel.
- When we look at denial rates by race or ethnicity, denial rates do not disappear but are narrower using the RDR analysis. This suggests that a large component of the racial and ethnic differences in the ODR is because of differences in borrower credit.
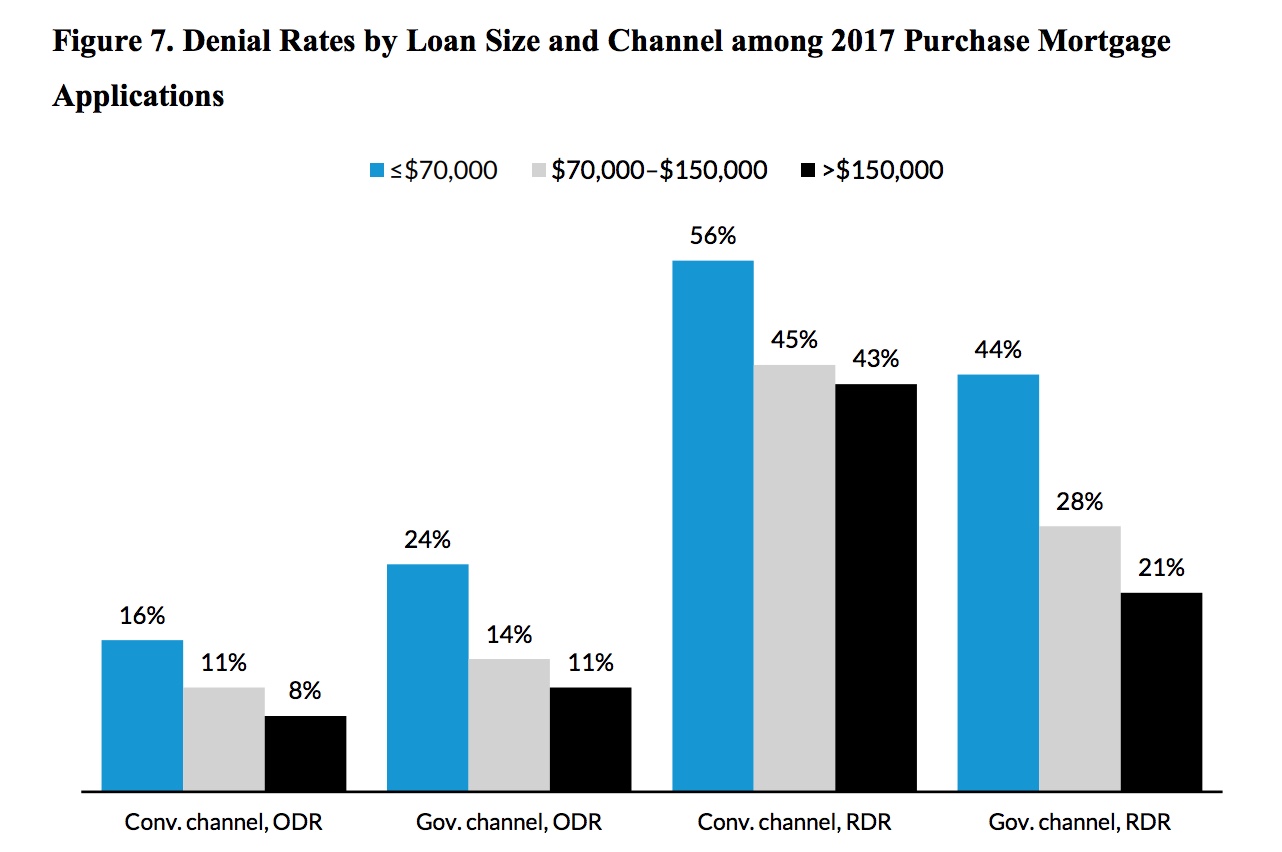
- The RDR is higher for small-dollar mortgages than for larger loans. The differences are especially large in the government loan market.
Ideally a measure would hold the credit profile of the application pool constant, but this would limit information to applicants who receive loans, so the researchers created a database by classifying borrowers of single-family, owner occupied homes as either high-credit-profile (HCP) borrowers who will never be denied a mortgage and low-credit-profile (LCP) borrowers who might be denied.
They determined the HCP/LCP classifications by looking at credit characteristics from the anonymous HMDA database which includes applicant income, loan amount, race/ethnicity, loan purpose and whether the loan was granted, but does not have information on loan-to-value (LTV) or debt-to-income (DTI) ratios, documentation type, credit scores, or loan product. These characteristics were gathered from CoreLogic proprietary's database, also anonymous. They matched up the two sets using common fields like geography, origination date, loan amount, etc. This resulted in a data set with both borrower and loan characteristics and whether they applied for a risky product.
They then determined whether a borrower fell into the LCP category by looking at the historical default rates of mortgages with the same characteristics based on the actual experience with various combinations (a total of 360 different ones) of LTV, DTI, Credit scores and other characteristics for loans originated in 2001 and 2002, a proxy for a normal period and in 2006-2007 a proxy for a stress period. Those defined as HCP customers, with little chance of being denied, were those who applied for loans without risky features and had a FICO score over 700, an LTV under 78 percent and a DTI less than 30 percent. Those with a 100 percent probability of being LCP consumers were those who applied for loans without risky features, had a FICO score below 580, an LTV and a DTI over 95 percent and 50 percent respectively. They then did a linear transformation of expected default risk for consumers with credit risk in between the two groups and assigned a probability of being LCP accordingly.
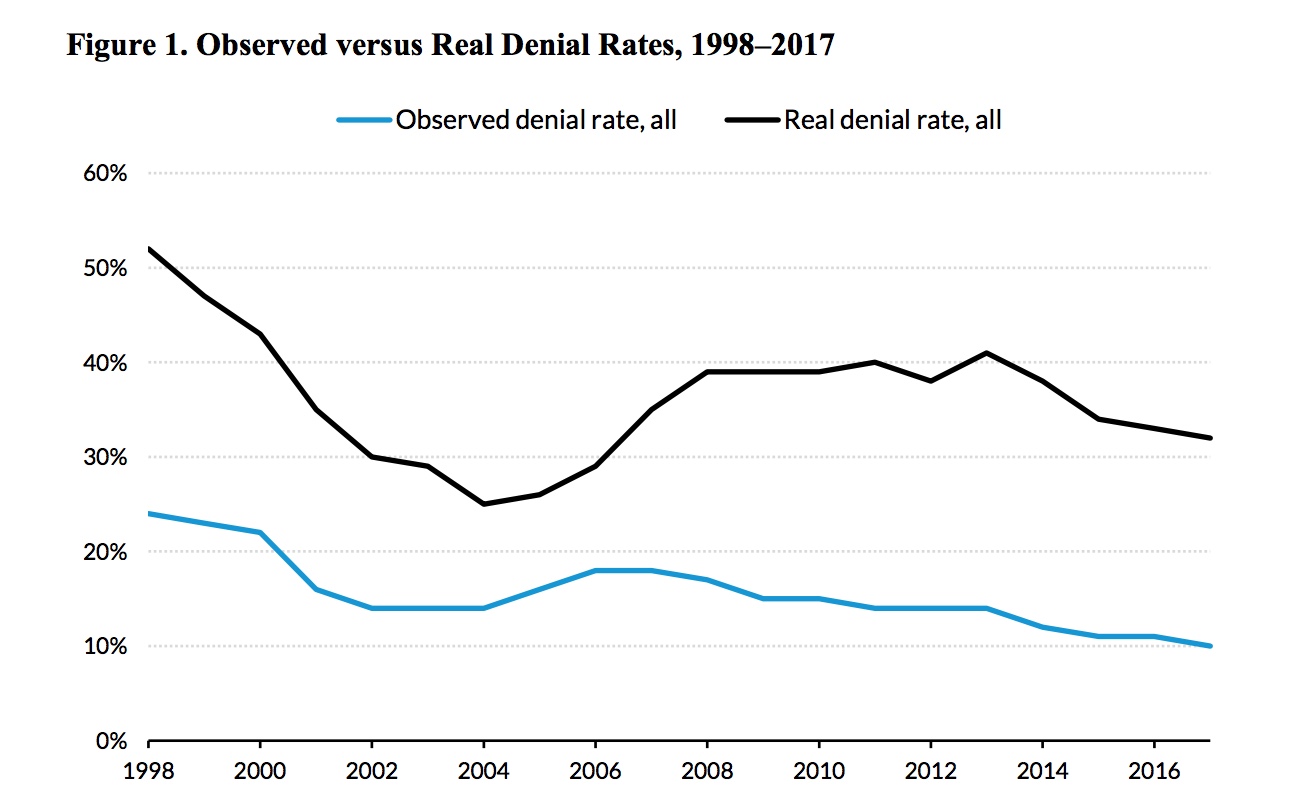
According to HMDA data there were 6,779,433 mortgage applications received in 2006. Lenders denied 1,219,790 and approved 5,559,643, resulting in a traditional ODR of 18 percent. However, the constructed database indicated that, of the 5,559,643 approved loans, 2,961,006 (53 percent) were from LCP consumers and 2,598,637 (47 percent) were from HCP consumers who, by definition, have a zero probability of default. Therefore, 4,180,796 applications are from LCP borrowers and all denied applications must come from that pool, giving an RDR of 29 percent. ODRs understate the difficulty of applicants with marginal credit obtaining a mortgage; the RDR is a more accurate measure.
The authors also looked at the results over time. The ODR for 2006 (18 percent) is higher than the ODR in 2017 (11 percent) suggesting that credit was tighter in 2006 than in 2017. Changes in applicants' credit profiles explain the counterintuitive results. In 2006, 62 percent of loans were to LCP applicants, versus 31 percent in 2017. In the boom years, more LCP applicants were encouraged to submit applications; thus, there were more rejections. As the credit box tightened after the financial crisis, many LCP borrowers were discouraged from applying, leading to fewer rejections. The RDR is 32 percent in 2017 versus 29 percent in 2006. It rose sharply post-crisis, peaked at 41 percent in 2013, and has declined over the past few years, reflecting the loosened credit box.
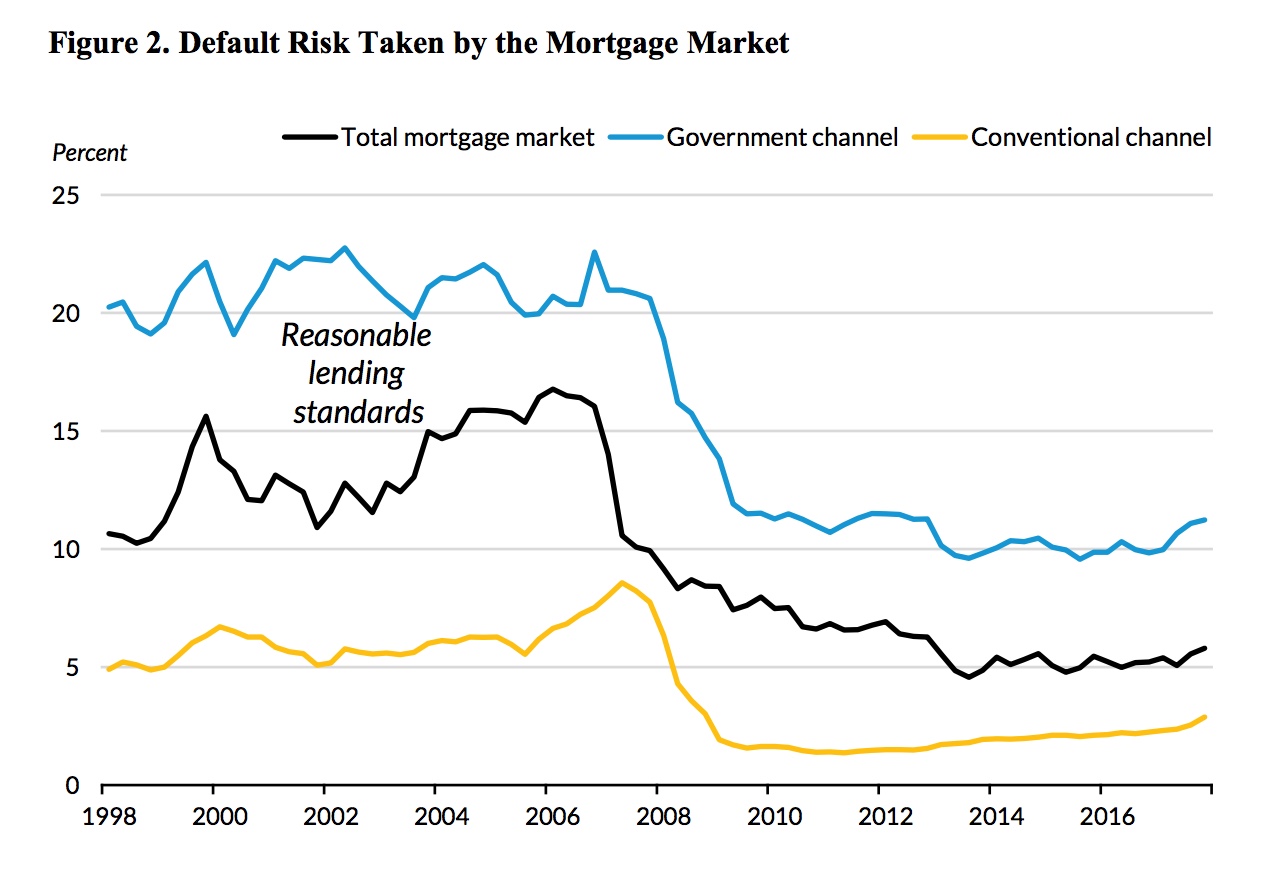
The share of LCP applicants has decreased steadily since the financial crisis, it rose from 49 percent in 1998 to 58 percent in 2005-2007, dropped to 39 percent in 2008 to 2010 and has been at 32 percent since 2011. But the RDR indicates the credit box has loosened as does UI's Housing Credit Availability Index (HCAI) which measures the default probability of mortgages underwritten in any given period. Figure 2 shows the same pattern for both; loose credit from 2005 to 2007, a dramatic tightening until 2013, and a marginal loosening since. But the HCAI shows the market is taking less than half the credit risk it was taking before the crisis and the RDR explains why.
After controlling for the variability in the applicant mix through the boom and bust, the RDR analysis shows that the real denial rate from 2011 to 2017 is similar to the pre-bubble period of 1998 to 2004; 36 versus 37 percent. But the share of LCP applicants is lower, 32 percent in recent years compared to 49 percent in the pre-bubble era.
The RDR is also more accurate regarding denials by loan channel - government or conventional. The former has traditionally been disproportionally used by low- and moderate-income and minority consumers so the authors say these loans would seemingly be easier to apply for than conventional loans and denial rates should be lower. The ODR measure confirms this was the case before the financial crisis but afterward suggests lower denial rates for the conventional channel.
However, the average share of LCP applicants in the conventional channel was 45 percent through 2004 rising to 56 percent in 2005 to 2007, then 25 percent from 2008 to 2010, and 20 percent since. The LCP shares in the government channel were 65, 77, 55, and 52 percent in those periods. Following the crisis, the conventional channel changed to more risk-based pricing while government channels do not price for risk. The government channel is now more economical for LCP applicants than the conventional channel, holding down their numbers.
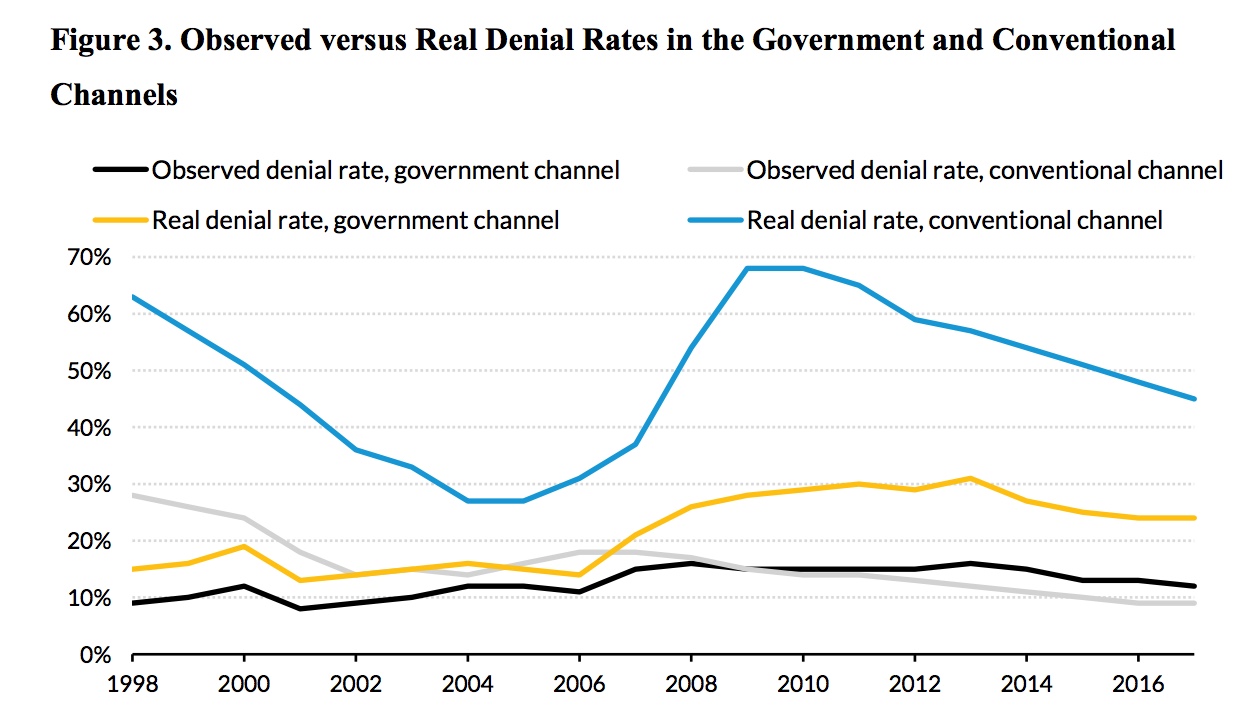
The conventional channel consistently has a higher RDR than the government channel. The least differential occurred during the bubble years when nontraditional products (i.e. negative amortization, teaser rates) composed a significant portion of originations. Those products remained a small part of government origination.
The RDR also shows smaller denial rates by race and ethnicity than the ODR. The later indicates that, in 2017, black applicants had twice the denial rates of white applications. Hispanics had 1.4 times and Asians 1.2 times the white denial rate.
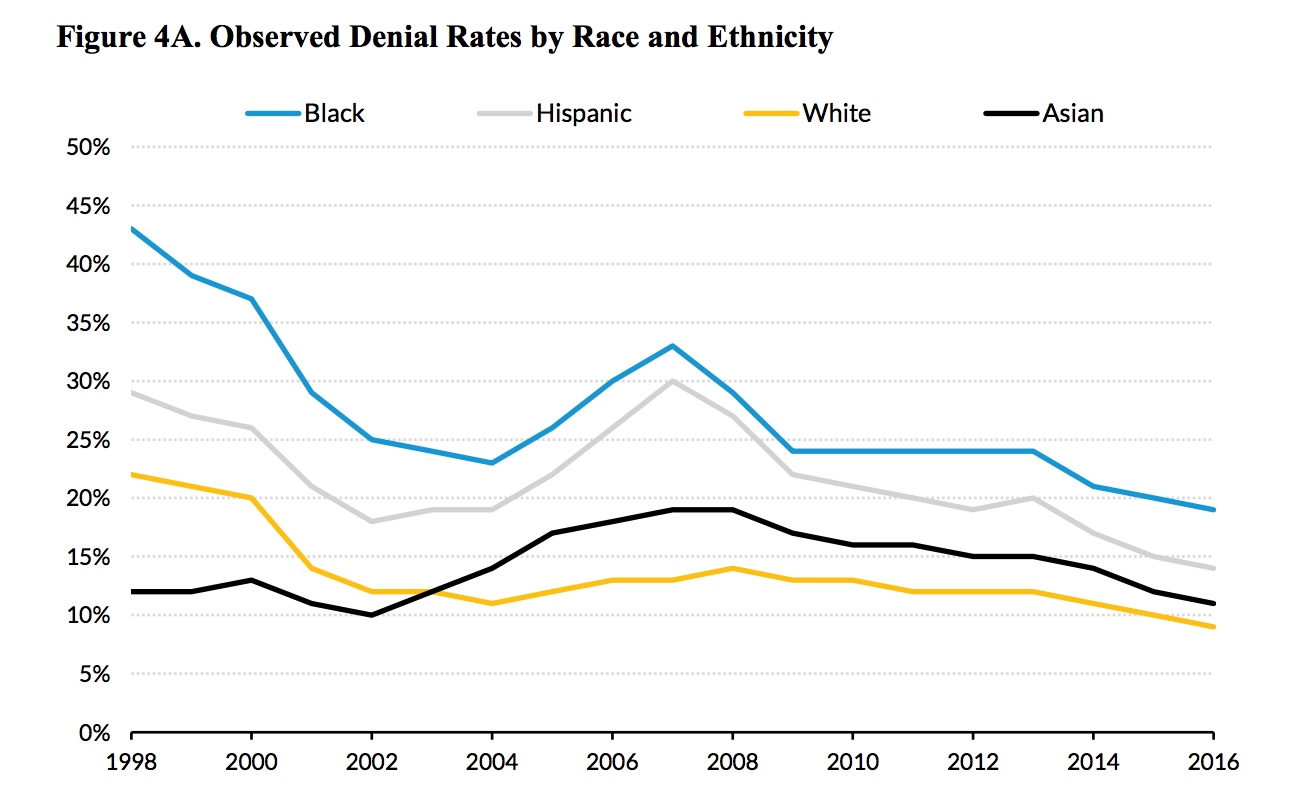
The authors say their analysis again shows that the differences in denial rates primarily reflect differences in credit characteristics. A much higher percentage of blacks and Hispanics fall into the LCP category than whites and Asians and they had lower FICO scores, higher LTV and DTI ratios, and lower incomes than their white and Asian counterparts. When the RDR analysis was done on these subgroups, black applicants had 1.2 times the denial rate of white applicants in 2017, Hispanic applicants had 1.1 times and Asian applicants 1.4 times the white denial rate.

The RDR analysis also shows higher denial rates for small dollar mortgages, i.e. those under $70,000. Th ODR shows a rate of 18 percent in 2017, double that for loans over $150,000. An analysis shows an RDR for the smallest loans of 52 percent and significant differences across channels.
The authors conclude that, by considering only borrowers with low credit profiles, the real denial rate reduces the distortion varying credit profiles have on the observed denial rate and shows a more intuitive pattern over time. The analysis indicates that the real denial rate peaked in 2013 and has been dropping ever since. But the share of low-credit-profile borrowers has been steadily declining. Thus, the increase in credit availability reflects a decrease in the denial rate of those applying, not a broadening of the applicant pool.


