
The rate of appreciation in home prices slipped again in May according to the S&P CoreLogic Case-Shiller U.S. National Home Price Index. The metric, which covers all nine U.S. census divisions, came in at a 3.4 percent year-over-year increase compared to a 3.5 percent in April. On a monthly basis the index was up 0.8 percent before seasonal adjustment and 0.2 percent afterward.
The two city-based composite indices showed similar deceleration. The 10-City Composite slipped from 2.3 percent in April to 2.2 percent and the 20-City Composite posted appreciation of 2.4 percent, down 0.1 point from the previous month. The monthly increases on a non-adjusted basis were 0.5 percent and 0.6 percent respectively while each index reported adjusted monthly growth of 0.1 percent. Nineteen of 20 cities reported higher prices before seasonal adjustment, while 13 of 20 cities did so afterward.
The metro areas with the largest annual appreciation were again Las Vegas with a 6.4 percent price increase, Phoenix at 5.7 percent and Tampa, up 5.1 percent. Seven of the 20 cities reported greater price increases in the year ending May 2019 versus the year ending April 2019.
"Nationally, year-over-year home price gains were lower in May than in April, but not dramatically so and a broad-based moderation continued," says Philip Murphy, Managing Director and Global Head of Index Governance at S&P Dow Jones Indices. "Among 20 major U.S. city home price indices, the average YOY gain has been declining for the past year or so and now stands at the moderate nominal YOY rate of 3.1 percent.
"Though home price gains seem generally sustainable for the time being, there are significant variations between YOY rates of change in individual cities. Seattle's home price index is now 1.2 percent lower than it was in May 2018, the first negative YOY change recorded in a major city in a number of years. On the other hand, Las Vegas and Phoenix, while cooler than they were during 2018, remain quite strong at 6.4 percent and 5.7 percent YOY gains, respectively. Whether negative YOY rates of change spread to other cities remains to be seen; for now, there is still substantial diversity in local trends. Nationally, increasing housing supply points to somewhat weakened demand, but the fact that seven cities experienced stronger YOY price gains in May than they did in April suggests an underlying resiliency that may mitigate the risk of overshooting to the downside at the national level."
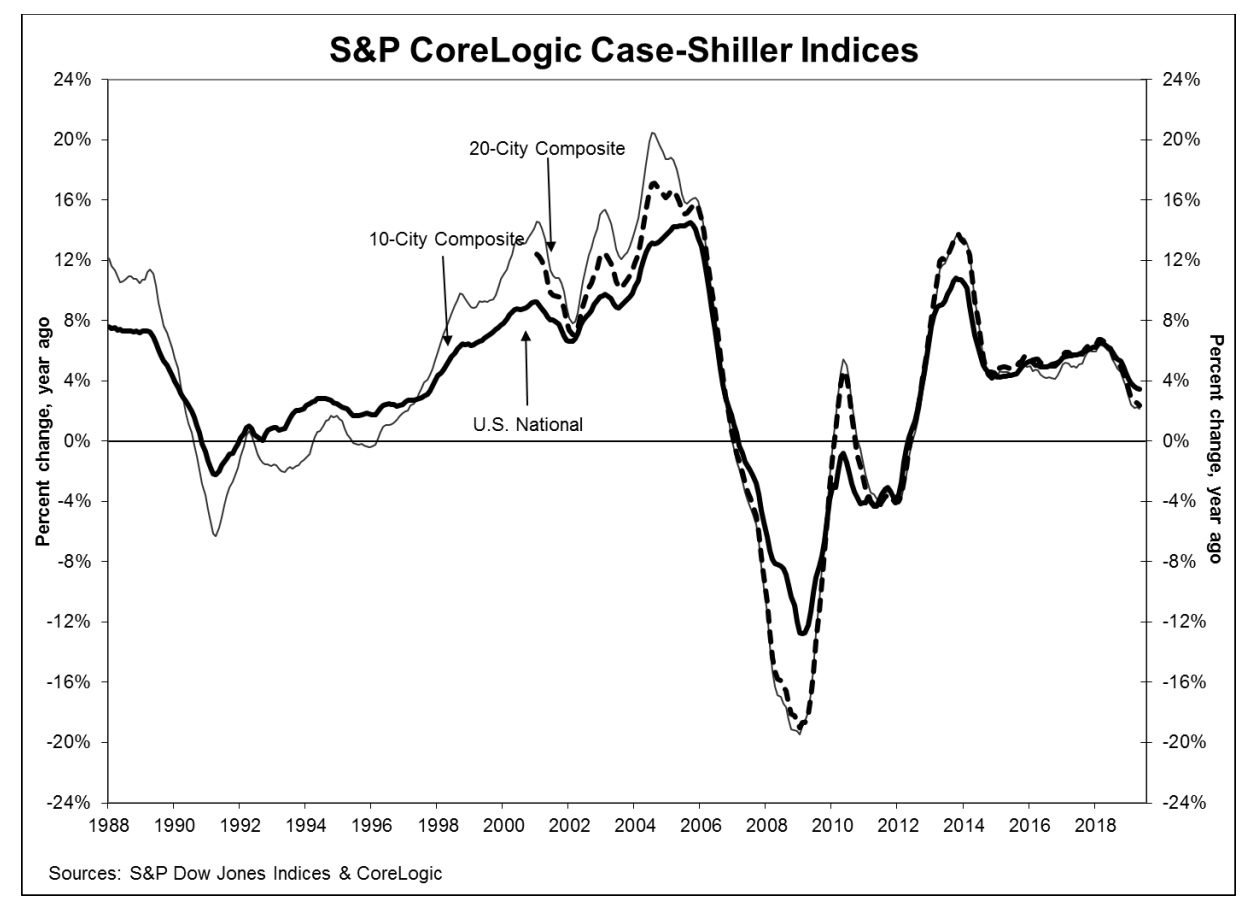
All three of the Case-Shiller indices remain above their previous peaks reached in the summer of 2006. The National Index is 13.6 percent higher; the 20-City is up 5.0 percent and the 10-City 1.7 percent. All have risen at least 56 percent since hitting the post crisis trough in the winter of 2012.
The S&P CoreLogic Case-Shiller Home Price Indices are constructed to accurately track the price path of typical single-family home pairs for thousands of individual houses from the available universe of arms-length sales data. The National U.S. Home Price Index tracks the value of single-family housing within the United States. The indices have a base value of 100 in January 2000; thus, for example, a current index value of 150 translates to a 50 percent appreciation rate since January 2000 for a typical home located within the subject market.
As of May 2019, the National Index was at 209.66, up from 207.97 in April. The 10- and 20-City Composites had readings of 230.12 and 216.94 respectively, compared to 229.06 and 215.68 the prior month. Los Angeles has the highest index at 286.73 and Cleveland the lowest at 124.98.


