
May set yet more records for price increases. Both the S&P CoreLogic Case-Shiller U.S. National Home Price Index and the Federal Housing Finance Agencies (FHFA) purchase only House Price Index (HPI) reported the highest annual rates of appreciation in their respective records.
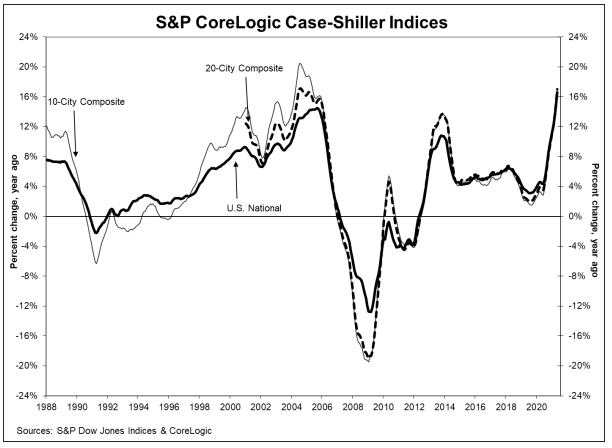
The Case-Shiller National Index, which covers all nine U.S. census divisions, reported 16.6 percent year-over-year growth in May, up from 14.8 percent in April, its 12th straight month of accelerating gains and the highest annual increase on record. The 10-City Composite annual increase came in at 16.4 percent compared to 14.5 percent the previous month and the 20-City Composite rose 17.0 percent, a 2 percentage point increase from the April rate.
Phoenix, San Diego, and Seattle reported the highest annual gains among the 20 cities. Phoenix led the way for the 24th time with a 25.9 percent rate of appreciation, followed by San Diego with 24.7 percent and Seattle at 23.4 percent. Price growth accelerated in all 20 cities in the year ending May 2021 versus the one that ended in April. As was the case last month, prices were strongest in the West (+19.9 percent) and Southwest (+19.8 percent), but every region logged double-digit gains."
Before seasonal adjustment, the National Index was 2.14 percent higher in May than the prior month, also a series high, and 1.7 percent higher after seasonal adjustment. The 10-City index rose 1.9 percent, 1.7 percent after adjustment, and the 20-City posted gains of 2.1 percent and 1.8 percent, respectively. All 20 cities reported increases before and after seasonal adjustments.
CoreLogic Deputy Chief Economist Selma Hepp said, "While sustained spurts of home price growth are keeping economic watchers on their toes, underlying strength in consumer demand remains supported by a significant pool of accumulated savings and solid mortgage underwriting. Both are markedly different than the home price run-up seen in 2005. Nevertheless, improvements in availability of new listings will help release the tremendous pressure that competing buyers have put on home prices and home price growth, which is likely to slow by the end of the summer."
"A month ago, I described April's performance as 'truly extraordinary,'"," says Craig J. Lazzara, Managing Director and Global Head of Index Investment Strategy at S&P DJI, "and this month I find myself running out of superlatives. The 16.6 percent gain is the highest reading in more than 30 years of S&P CoreLogic Case-Shiller data. As was the case last month, five cities - Charlotte, Cleveland, Dallas, Denver, and Seattle - joined the National Composite in recording their all-time highest 12-month gains. Price gains in all 20 cities were in the top quartile of historical performance; in 17 cities, price gains were in top decile.
"We have previously suggested that the strength in the U.S. housing market is being driven in part by reaction to the COVID pandemic, as potential buyers move from urban apartments to suburban homes. May's data continue to be consistent with this hypothesis. This demand surge may simply represent an acceleration of purchases that would have occurred anyway over the next several years. Alternatively, there may have been a secular change in locational preferences, leading to a permanent shift in the demand curve for housing. More time and data will be required to analyze this question."
The S&P CoreLogic Case-Shiller Home Price Indices are constructed to accurately track the price path of typical single-family home pairs for thousands of individual houses from the available universe of arms-length sales data. The National U.S. Home Price Index tracks the value of single-family housing within the United States. The indices have a base value of 100 in January 2000; thus, for example, a current index value of 150 translates to a 50 percent appreciation rate since January 2000 for a typical home located within the subject market.
As of May 2021, the National Index was at 254.92 compared to 249.04 in April. The 10- and 20-City Composites had readings of 275.50 and 262.70, up from 270.21 and 257.10 the prior month. Los Angeles has the highest index reading at 346.81. Cleveland and Detroit continue to battle over last place on the list. Cleveland unseated Detroit in May with a reading of 149.92.
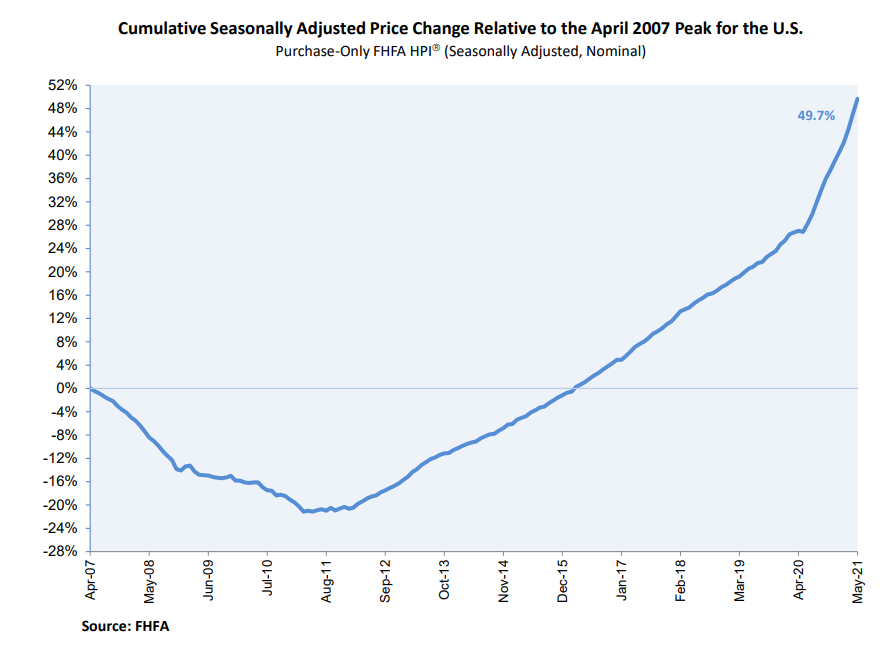
The FHFA HPI put the annual increase for May even higher than did Case-Shiller, 18.0 percent. Its number also represented a higher rate of acceleration; the annual gain in April was 15.7 percent. There was a slight decline in the month-over-month price change, from 1.8 percent in April to 1.7 percent in May.
"House prices continued their record-setting growth into May," said Dr. Lynn Fisher, FHFA's Deputy Director of the Division of Research and Statistics. "This trend will likely continue around the country as busy summer homebuying months maintain the pressure being felt in already tight housing markets."
For the nine census divisions, seasonally adjusted monthly house price changes from April to May ranged from +1.0 percent in the Middle Atlantic division to +2.4 percent in the Pacific division. The 12-month changes ranged from +15.4 percent in the West South Central division to +23.2 percent in the Mountain division.
The FHFA HPI is based on the selling price of homes financed by one of the GSEs, Fannie Mae or Freddie Mac. It was benchmarked at 100 on January 1, 1991 and is currently at 337.4.


