
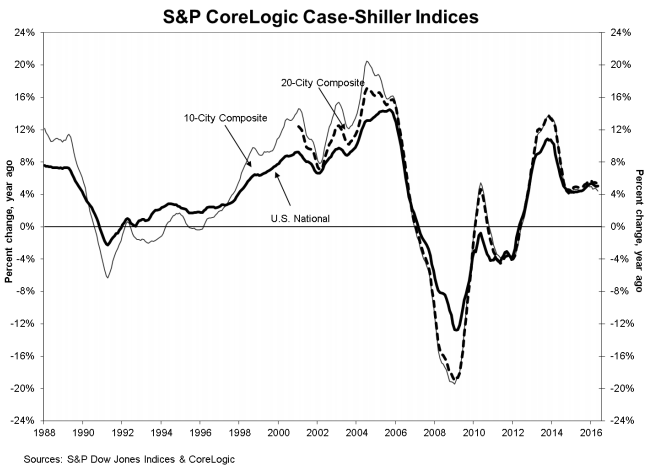
The newly named S&P CoreLogic Case-Shiller Indices noted a continued rise in prices across the country although some monthly indices declined. The National Index which covers all nine census divisions, rose 5.0 percent on a non-seasonally adjusted basis from May 2015 to May 2016, the same annual increase as was posted in April. On a monthly basis the unadjusted index gained 1.2 percent in May and the seasonally adjusted version rose by 0.2 percent.
The 10-City Composite Index eased back from its 4.7 percent annual increase in April to 4.4 percent in May while it gained 0.8 percent for the month on a non-seasonally adjusted basis. The index declined by 0.2 percent after adjustment.
There was a similar report for the 20-City Composite. It rose by 5.2 percent year-over-year (compared to 5.4 percent in April) and was up 0.9 percent unadjusted and down 0.1 percent after adjustment.
The 20-City is used by Econoday to solicit analysts' opinions. The actual numbers were disappointing by that measure, coming in below the most pessimistic estimates for both monthly and yearly values. The range of monthly predictions for the adjusted index was for an increase of 0.3 to 1.3 percent with a consensus of 0.4 percent. The forecast for the year-over-year number ranged from 5.3 to 6.3 percent, averaging 5.6 percent.
Portland, Seattle, and Denver have reported the highest year-over-year gains among the 20 cities over each of the last four months. In May, Portland led the way with a 12.5% year-over-year price increase, followed by Seattle at 10.7%, and Denver with a 9.5% increase. Eight cities reported greater price increases in the year ending May 2016 versus the year ending April 2016. On a monthly basis 12 cities saw prices rise on a seasonally adjusted basis, two cities were unchanged, and six cities experienced negative monthly prices changes.
"Home prices continue to appreciate across the country," says David M. Blitzer, Managing Director and Chairman of the Index Committee at S&P Dow Jones Indices. "Overall, housing is doing quite well. In addition to strong prices, sales of existing homes reached the highest monthly level since 2007 as construction of new homes showed continuing gains. The SCE Housing Expectations Survey published by the New York Federal Reserve Bank shows that consumers expect home prices to continue rising, though at a somewhat slower pace."
"Regional patterns seen in home prices are shifting. Over the last year, the Pacific Northwest has been quite strong while prices in the previously strong spots of San Diego, San Francisco and Los Angeles saw more modest increases. The two hottest areas during the housing boom were Florida and the Southwest. Miami and Tampa have recovered in the last few months while Las Vegas and Phoenix remain weak. When home prices began to recover, New York and Washington saw steady price growth; now both are among the weakest areas in the country."
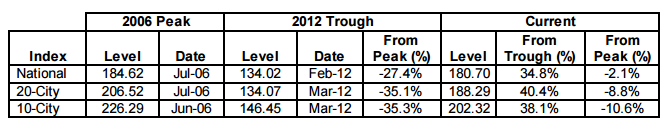
As of May 2016, average home prices for the MSAs within the 10-City and 20-City Composites are back to their winter 2007 levels. The table below shows the housing boom/bust peaks and troughs for the three composites along with the current levels and percentage changes from the peaks and troughs.
We should note that Karl "Chip" Case, who along with Robert Shiller created the Case-Shiller indices in the 1980's, died last week at age 69. Stan Humphries, Zillow's chief economists said that before the index "there was very little transparency in housing beyond what one could glean at a dusty local registry office or by poring over years of county tax records - which wasn't much. The kind of "basic" housing data we take for granted today, the ability to see how a given housing market has performed over time and relative to other markets, was simply unavailable prior to Case and Shiller's pioneering efforts."
The S&P CoreLogic Case-Shiller Home Price Indices are constructed to accurately track the price path of typical single-family home pairs for thousands of individual houses from the available universe of arms-length sales data. The National U.S. Home Price Index tracks the value of single-family housing within the United States. The indices have a base value of 100 in January 2000; thus, for example, a current index value of 150 translates to a 50 percent appreciation rate since January 2000 for a typical home located within the subject market.
The 10-City Composite currently has an index level of 202.32 and the 20-City a value of 188.29. The National Index is at 180.70. Detroit continues to have the lowest index value at 106.61 and Los Angeles the highest at 248.00.


