
Freddie Mac said today that its Multi-Indicator Market Index or MiMi for May is sending out mixed signals to the housing market. While more markets entered their stable range of housing activity, most markets remained stalled, just as they were in April, due primarily to weak mortgage application activity.
MiMi is designed to monitor and measure the stability of the housing market nationally and in the states and 50 top metro markets relative to the long-term stable range in each. The index combines proprietary Freddie Mac data with current local market data on home purchase applications, payment-to-income ratios (changes in home purchasing power based on house prices, mortgage rates and household income), proportion of on-time mortgage payments and the local employment picture. The data is used to produce a composite number for each locality. MiMi also indicates whether each market is trending closer to, or further away from its stable range. The nation's all-time MiMi low of -4.49 was in November 2010 when the housing market was at its weakest.
In May the national MiMi stood at -2.64 points indicating a weak housing market overall. There was a a slight decline (-0.05 points) from the April level of -2.59 and a 3-month trend change of +0.06 points which is considered flat. However, on a year-over-year basis, the U.S. housing market has improved by 0.86 points from -3.50.
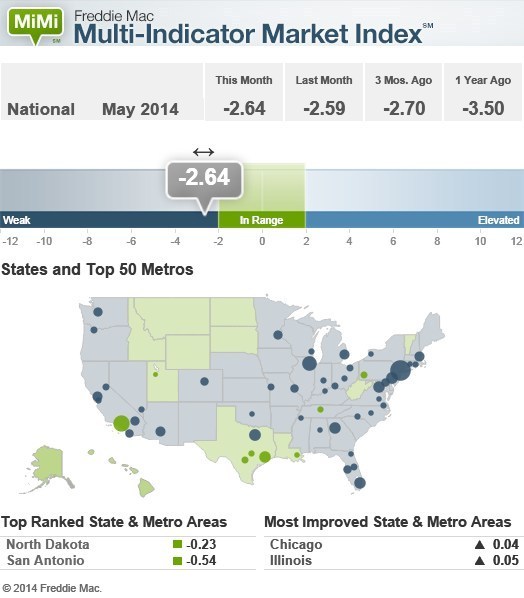
Thirteen states and the District of Columbia as well as 8 of the 50 metropolitan areas included in the data were in their stable range. Among the states, North Dakota, the District, Wyoming, Alaska, and Montana ranked highest and San Antonio, Austin, Salt Lake City, New Orleans, and Houston were the top metro areas.
Freddie Mac Chief Economist Frank Nothaft said, "We saw an additional handful of metro area s move back into their stable range in May despite most markets still trying to get beyond stall speed. When we look at the other MiMi indicators outside of mortgage purchase applications, the news remains positive - unemployment rates are coming down, more borrowers are paying their mortgages on time, and mortgage rates remain low. Moreover, while house price growth is moderating, many markets can still sustain additional house price gains while still maintaining strong homebuyer affordability. So we remain cautiously optimistic the housing recovery will continue, albeit slowly, until we see more tightening in the labor markets to give personal incomes a much needed jolt."
The greatest degree of improvement over April was shown by Illinois (+0.05), Massachusetts (+0.04) and New Mexico (+0.01) with Arkansas, Colorado, Montana and Ohio all tied (-0.02.). Florida (+1.68), Nevada (+1.60), California (+1.15), South Carolina (+1.14) and Idaho (+1.11) had the most significant year-over-year changes.
Among metros the more significant one month improvements were made by Chicago (+0.04), Riverside (+0.02), and Providence (+0.01).On an annual basis the most improved were Miami (+2.13), Orlando (+1.80), Las Vegas (+1.58), Riverside (+1.53), and Austin (+1.48).
Nine states and 17 metros are showing improved three month trends. One year ago 49 states and the District as well as 48 of 50 metros were showing improving on this basis.
Deputy Chief Economist Len Kiefer said it is no surprise that markets aren't improving as fast as they did last year. "Nevertheless, it's encouraging to see more markets healing. The standout this month is the Salt Lake City metro area with three of its four MiMi indicators back in their stable range of activity. In fact, on a yearly basis, the metro area finds its purchase applications are up on a year-over-year basis. The positive trend in home purchase applications reflects a strong local labor market, with employment growth in the Salt Lake City metro area about double the national average."


