
The housing industry has been looking for a slowdown in home price growth for several years, but quite the contrary has occurred. Black Knight Financial Services, in its current edition of its Mortgage Monitor, notes that the 1.3 percent monthly increase in its Home Price Index (HPI) in March was the highest in nearly four years, and that was followed by a 1.2 percent gain in April. Through the first four months of the year, prices were up 3.6 percent compared to 2.9 percent over the same period in 2016. When viewed on an annual basis, the increase is 60 basis points higher than the rate in December 2016. The year-to-date pace is the highest since 2013's gain of 4.1 percent.
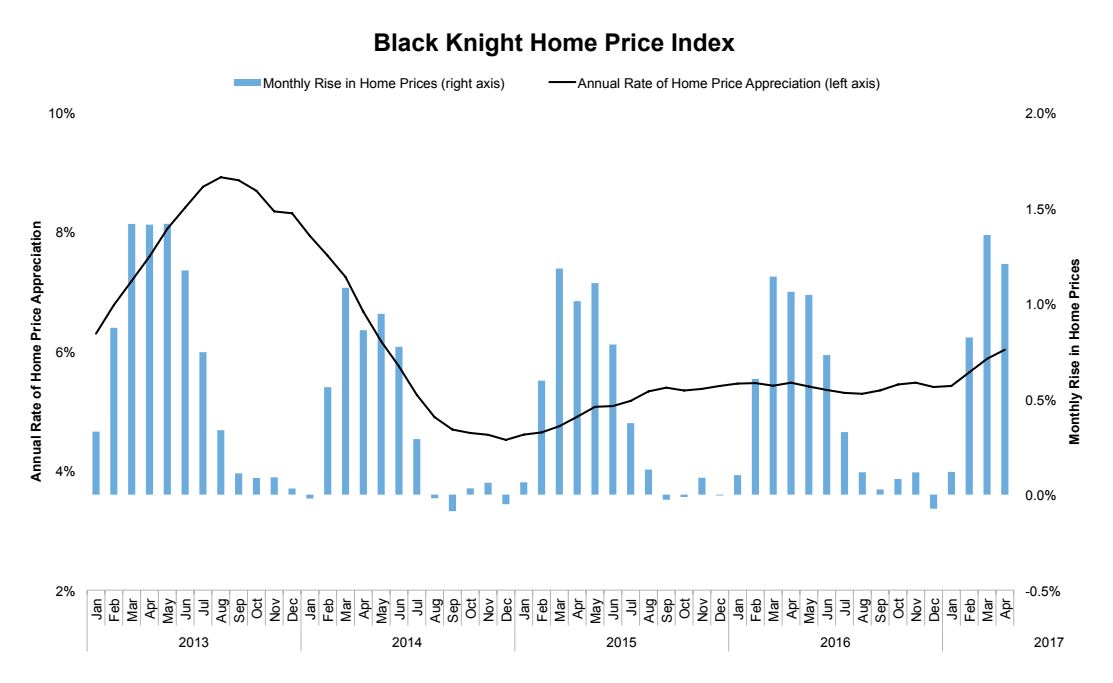
The trend is widespread. Prices have risen so far this year in every state but Maine and West Virginia and four, Washington, Oregon, Colorado, and Michigan, have seen increases of at least 5 percent, 7 percent in Washington. The rate of appreciation has accelerated in 35 states. Black Knight points out, however, that February to June are typically the months with the greatest gains, then they ease in the summer through years-end.
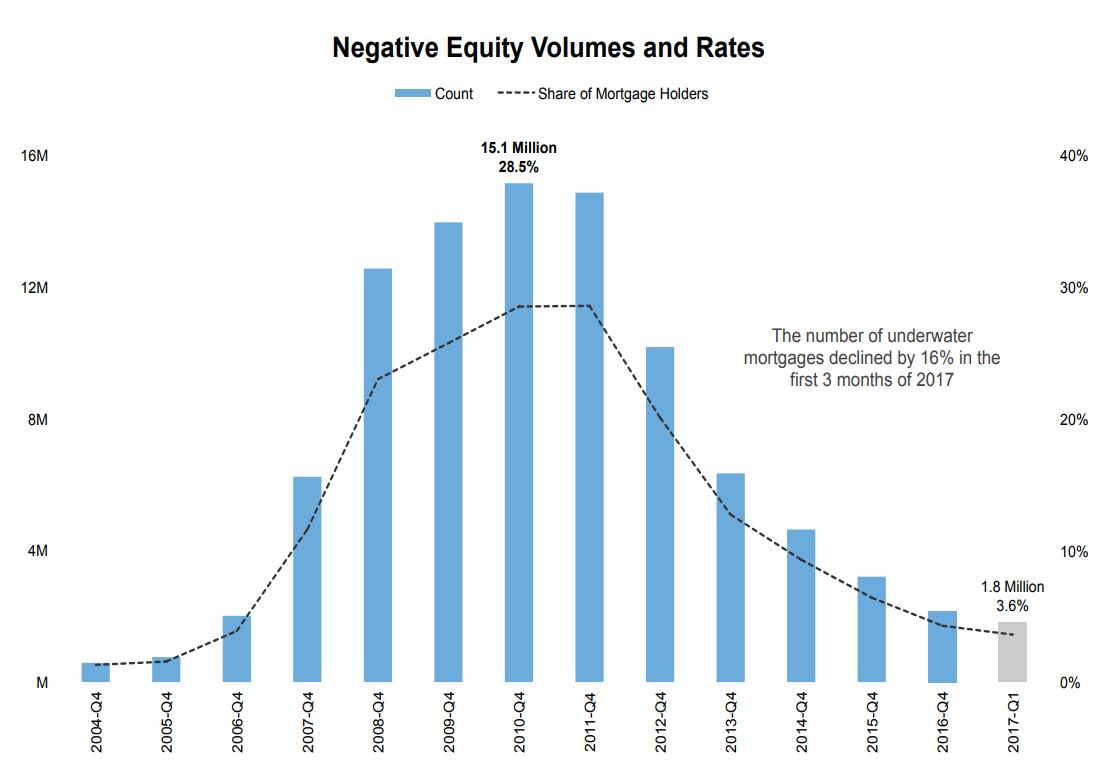
These increases, along with ongoing foreclosure activity, have continued to reduce the nation's once dangerously high levels of negative equity. Black Knight looks at the improvement, but notes a growing pattern of discrepancy.
Over the past year there has been a 35 percent decline in underwater mortgages, a 16 percent drop in the first quarter of 2017 alone. At the end of that period, 3.6 percent of homes lacked equity, about 1.8 million homes. It was the first time since 2006 the total has fallen under 2 million. In 2011, negative equity affected 15.1 million homes, 28.5 percent of all those with a mortgage. Despite this improvement, the rate is still high by historic standards; in 2005 only 750,000 borrowers owed more on their mortgages than their homes were worth.
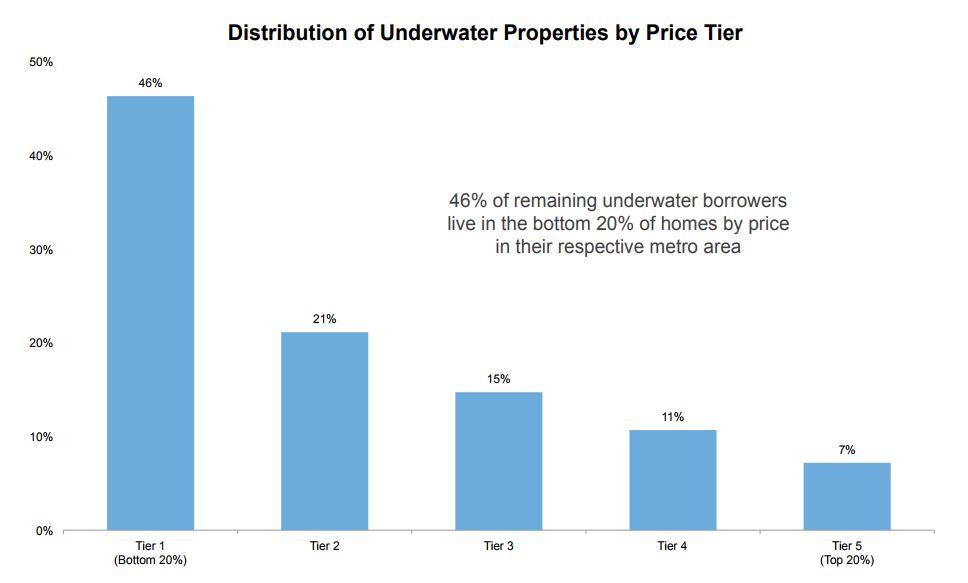
Black Knight divides houses into five price tiers, each representing 20 percent of the housing stock. The company points out that, even though the overall rate of negative equity has fallen, the disparity among those tiers is notable. It is increasingly concentrated among borrowers whose homes fall into the bottom 20 percent of home prices in their respective markets.
Nearly half of all those borrowers who still lack equity own homes in that lowest tier where there is an 8.3 percent negative equity rate compared to the 3.6 percent national rate noted above. In fact, Tier 1 properties are more than twice as likely to have negative equity as those in the next higher price range, and 6.5 percent more likely than those in the top 20 percent. Black Knight Data & Analytics Executive Vice President Ben Graboske says this is the most inequitable distribution they have observed since they began tracking equity in 2005, calling the disparity in some localities "staggering."
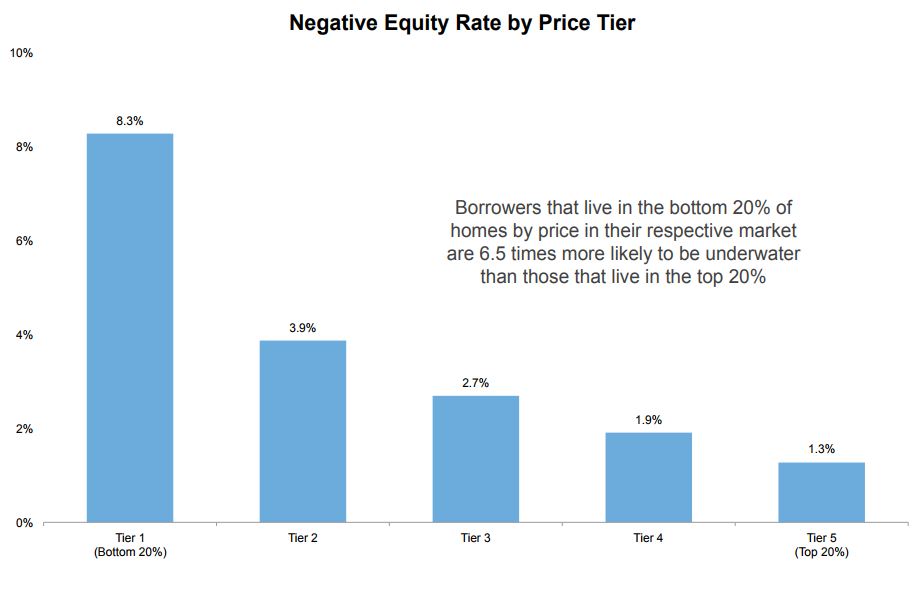
That disparity is even more evident, as Graboske says, at the metropolitan statistical area (MSA) level. For example, in Nevada, 17 percent of borrowers who own Tier 1 homes are underwater compared to 4.6 percent of those in Tier 5, a 4:1 ratio, the lowest of any metro area tracked. In Detroit, Cleveland, and Memphis over a quarter of Tier 1 homes are underwater. In Detroit, the ratio is 50:1.

While the growth of home prices has been greatest among lower priced homes at the national level, Black Knight suggests that some neighborhoods and borrowers are being left behind. This is compounded by a typically lower loan-to-value (LTV) ratio of lower priced homes at origination.
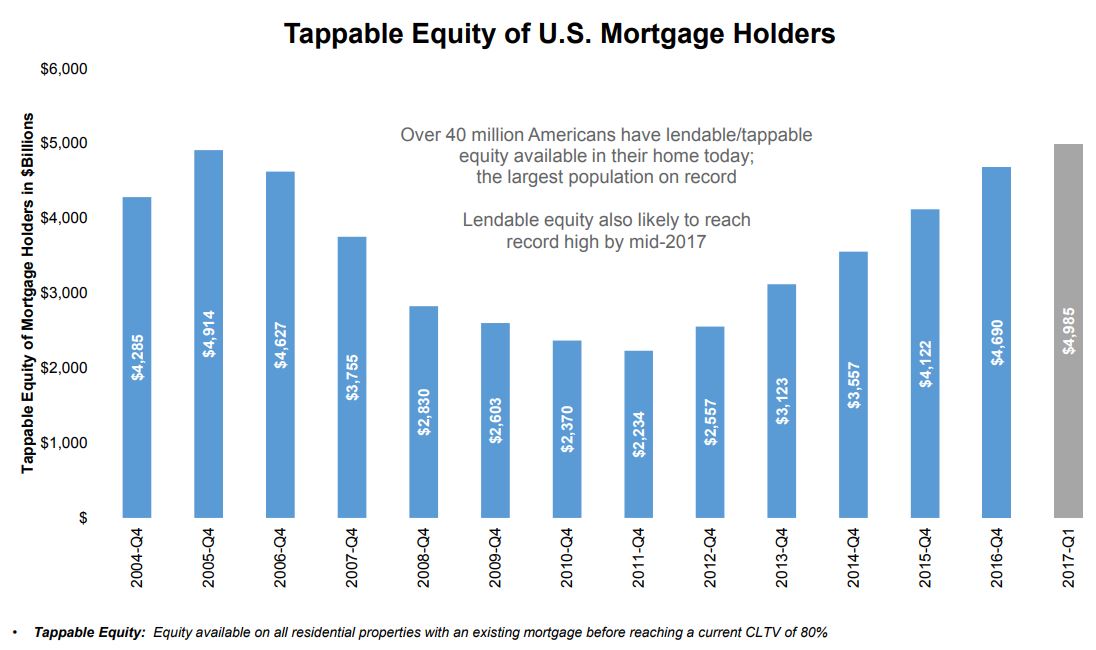
Rising home values are also increasing the likelihood that homeowners will refinance to tap their growing equity. The Monitor reports that over 40 million Americans have "tappable" amounts of equity - 20 percent or more. That tappable amount has risen by $695 billion from last year to just under $5 trillion. At the current rate of home price increases, the company expects lendable equity to hit a record high by the end of the summer.
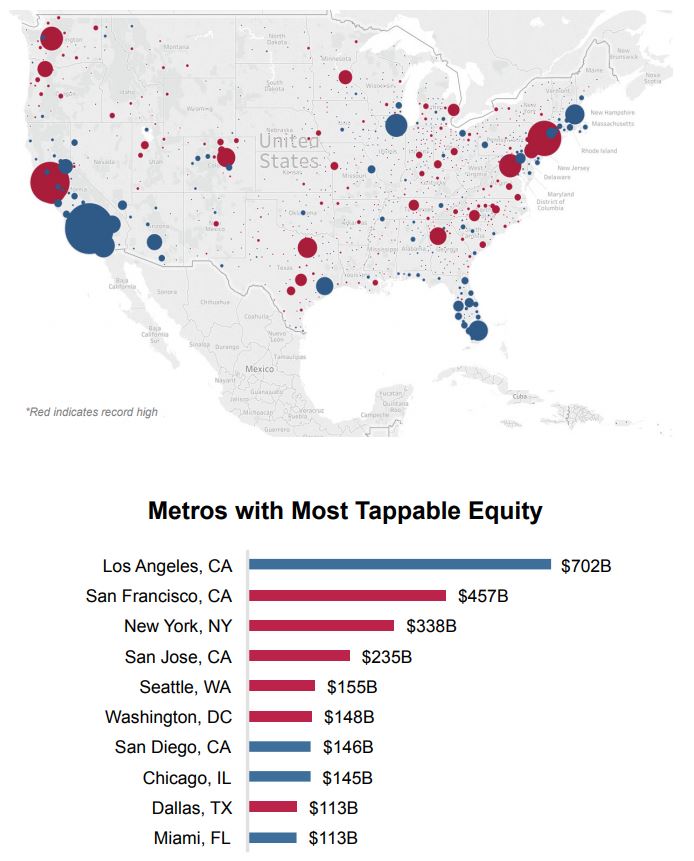
Again, there are strong regional variations; the majority of that equity is found in coastal areas, California along has nearly 40 percent of the total, and more than half is concentrated in the 10 largest metro areas. Nearly half of the 100 largest areas have already set new highs, including five of the six largest. Even though Los Angeles is not among the five setting a new record, it still holds the largest pool, estimated at $702 billion, followed distantly by San Francisco ($457 billion) and New York ($338 billion.) Again, showing the uneven nature of price increases and equity growth, only 400 of the total 900 Census Bureau Statistical Areas have reached record levels of tappable equity.
Black Knight also looked at how rising equity, along with the shifting interest rate environment, is changing refinancing. They note that while refinancing overall declined from the fourth quarter of 2016 to the first quarter of this year, the decline was smaller for cash-out transactions. There were 360,000 cash out refinances during the first quarter, and while that was a 28 percent decline, the share of those loans rose to 52 percent, the highest since 2008. The volume of equity that was taken out, however, dropped by 21 percent to $24.9 billion, the first decline since the first quarter of 2014 when there was a similar environment that featured an abrupt rise in interest rates.
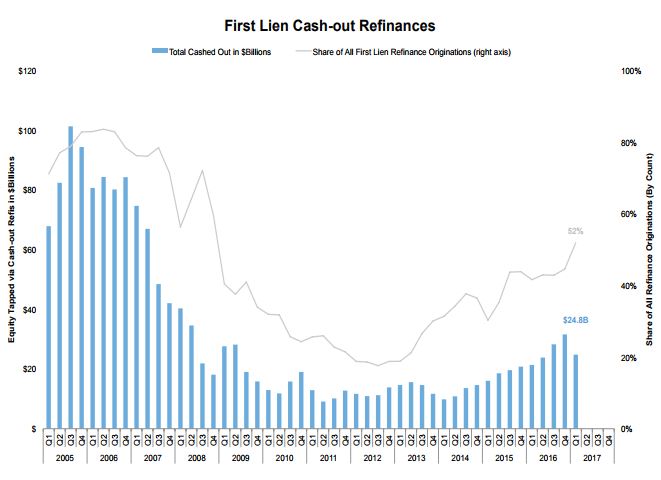
Black Knight says when interest rates are low it is hard to tell whether rates of available equity driving refinancing. At present, it appears to be the latter that is prevailing. For example, at times in 2013, borrowers who were cashing out were also saving an average of 172 basis points on their mortgage rate. In the first quarter of this year those savings averaged 45 basis points, suggesting that cash-out was the driving factor. Further, even though overall volume declined, the average refinancing borrower pulled out $69,000, the highest withdrawal in 10 years.
Seventy-five percent of cash-out refinances were of mortgages originated in 2009 and later. These borrowers have seen the greatest increase in home prices since they originated their mortgages, and likely have relatively low rates. This underscores equity as a prime motivator.
Borrowers who have held their mortgages for some time are now showing more inclination to cash-out, even those who took out mortgages during the housing boom. These borrowers probably have higher rates as well as having recovered equity, so will reap both lower rates and cash through refinancing.
Resulting loan to value ratios are the lowest on record, showing restraint on the part of borrowers and reflecting still tight lending standards.


