
Seven or eight years ago the home sales headline was the entry of big institutional investors into the single-family market. These investors, many of which were hedge funds, bought up hundreds of thousands of distressed homes, a large number of which were owner-occupied, to utilize as rental properties. Investors are still with us, in larger numbers than ever, but the mom-and-pop landlord model is back.
CoreLogic Deputy Chief Economist Ralph McLaughlin, writing in the company's latest MarketPulse said the share of homes bought by investors reached its highest level since Corelogic started tracking it in 1999, 11.3 percent. Most of the buyers appear to be small investors, those who purchase fewer than 10 homes, just getting into the game. They are focusing on the starter level home and on homes in markets with relatively high rents.
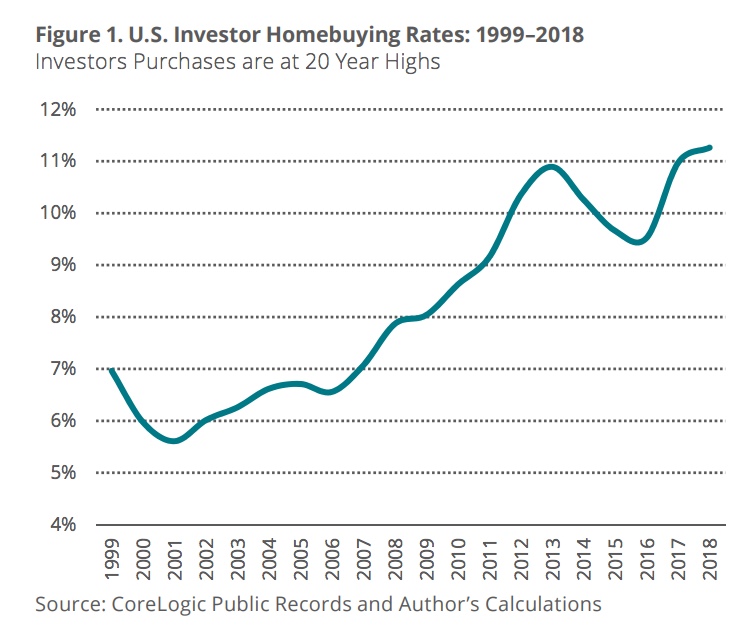
The 2018 share was only slightly higher than the 2017's 11.0 percent, the second highest on record, and both topped the 2012-2014 "investors buying fury" when their purchase rates were 10.3 to 10.9 percent. The share of investor purchases by small players rose from 48 percent in 2013 to more than 60 percent last year while the share purchased by large investors, those who purchase more than 101 homes, is now 15.8 percent. The in-between buyers (11 to 100 homes) account for a 22.7 percent of investor sales.

Investor purchase rates are highest among entry level homes. The share of starter homes purchased by investors peaked at 20.3 percent in both 2017 and 2018, while the share among middle and upper tier homes also peaked in last year, but at much lower rates of 7.8 and 6..3 percent respectively.
McLaughlin said investor homebuying rates vary sharply by location with the highest rates in the eastern half of the country. Among the top 10 metro areas for investor purchases, Detroit was highest at 27 percent, followed by Philadelphia and Memphis at 23.3 percent and 19.7 percent respectively. Only two were west of the Mississippi, Oklahoma City at 18.7 percent and Des Moines at 17.2 percent. Seven of the ten metros with the lowest investor rates however were in the West, all under 6 percent and four of the top five in California.
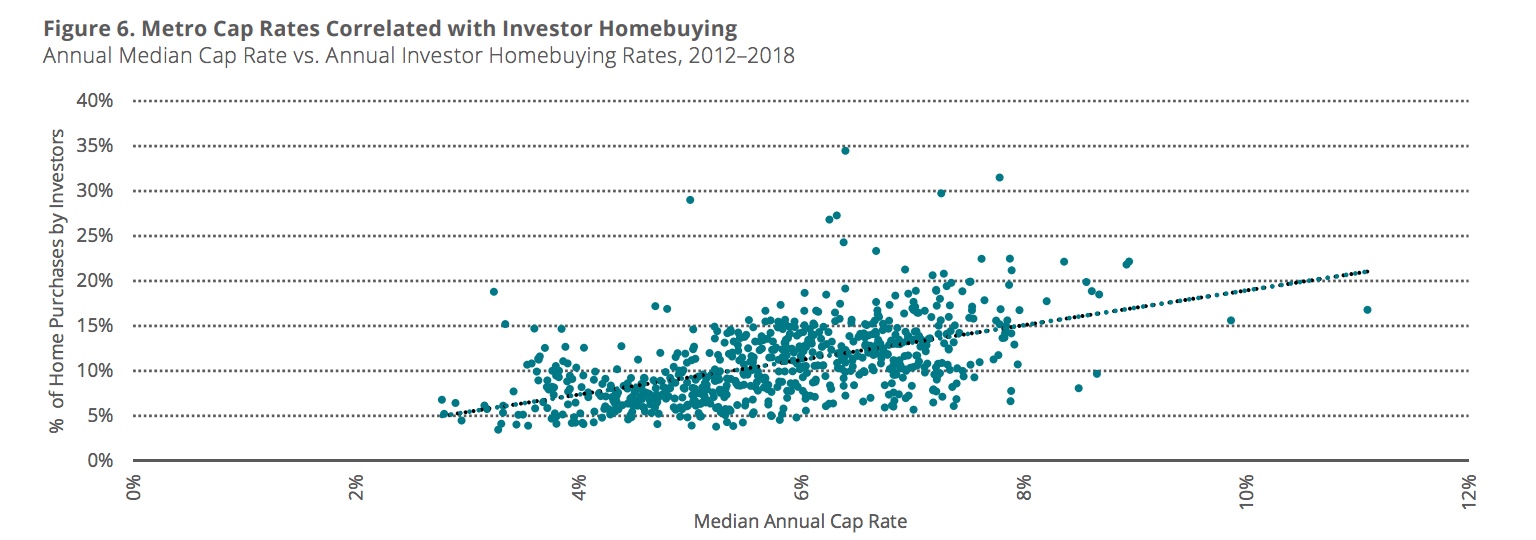
As might be expected, investors are attracted to markets where rents are high relative to home purchase prices. McLaughlin said the variation among markets was correlated with their cap rates, that is the ratio of annual rent collected compared to its value. For example, a property that cost $100,000 and returns $10,000 in annual rent has a cap rate of 10. Across the 100 largest markets the correlation between those rates and the level of investor involvement was a strong Pearson's R of 0.55. He notes that investors may have other considerations, but cap rates are a simple way of capturing other market level opportunities and risks such as expectations of future growth in home prices and vacancy rates.
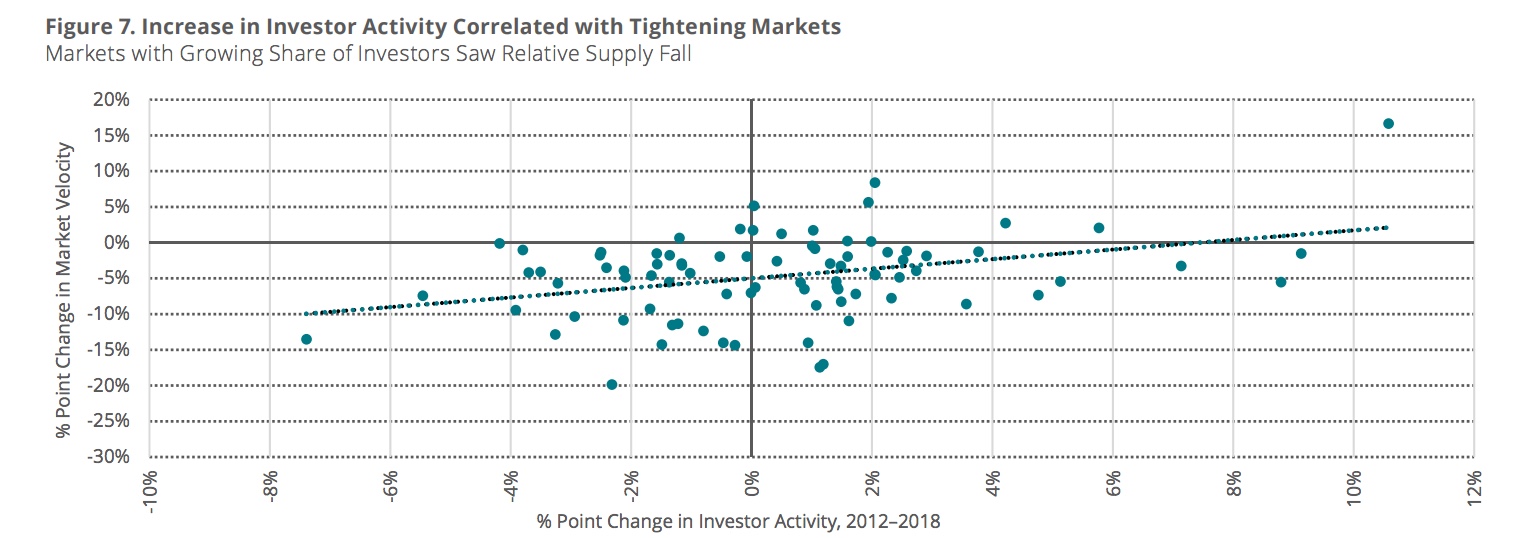
CoreLogic also found the increase in investor sales share from the bottom of the housing market in 2012 to 2018 also has a strong correlation with tightening housing markets. Across the 100 metro areas there was a correlation of 0.35 between the change in investor purchasing and the change in market velocity, i.e. how fast houses were selling.
McLaughlin says there is no conclusive evidence that investors are gobbling up properties that might otherwise have gone to owner occupants, calling the situation one of chicken and eggs. While more investors may increase competition and lower the supply of available homes relative to demand it might also be a tight supply that draws investors because they see lower risk. Investors may also be picking up the slack in markets where there is less owner-occupant demand. This may be evidenced by the popularity of Detroit, Philadelphia and Baltimore mentioned earlier. They have had less demand and slower price growth during the recovery than places with greater demand, higher appreciation, and little investor interest like many California cities.


