
In a report prepared for submission to Congress the Federal Housing Finance Agency analyzes the guarantee fees charged by Freddie Mac and Fannie Mae (the GSEs) in 2014 by product type, risk class, and the volume of a lender’s business. It also analyzes the costs of providing the guarantee.
G-fees are charged for guaranteeing investors timely payment of principal and interest on loans held in mortgage-backed securities (MBS) and are designed to cover three types of costs that can be incurred in providing the guarantee. These are the average costs the GSEs expect to bear as borrowers fail make their payments; the costs of holding economic capital to protect against potentially much larger, and unexpected such losses; and general and administrative expenses.
Of the three the cost of holding capital is by far the most significant. It is the amount of capital to protect against unexpected losses such as occurred during the recent housing crisis, multiplied by the target rate of return on that capital. While the GSEs do not currently hold material equity capital, FHFA expects them to set guarantee fees as though they did have these capital holding expenses and the proprietary models they use to estimate this have two primary macroeconomic components – the stressed house price path and the stressed interest rate path.
In addition to the macroeconomic scenarios, the models contain other risk characteristics:
- Borrower factors including credit history, debt to income and loan to value (LTV) ratios
- Mortgage insurance coverage
- Loan purpose (purchase, rate-term refinance, cash-out refinance)
- Occupancy status (primary home, investor)
- Property and product type
- Mortgage interest rate
The resulting estimate of required capital is subjected to a target rate of return and a model guarantee fee is calculated. Then the GSEs determine a “gap,” the difference between the actual g-fee charged and the model-based fee, or estimated cost of providing the guarantee. If the gap on a loan is positive or zero, the GSE expects to achieve at least its target rate of return on capital. Even with a negative gap there may still be a positive return, just not the target rate of return.
The lending environment must also be considered. Lenders have other alternatives for delivering loans to the GSEs such as retaining them in portfolio. If guarantee fees rise above the cost of the alternatives the GSEs market share might decrease.
Since 2008 the following changes to g-fees have been implemented.
- March 2008: an overall fee increase; upfront fees were introduced based on LTV and credit score, a 25-basis point upfront Adverse Market Charge was added.
- Late 2008 through 2011: gradual increase in fees by approximately 5 basis points; upfront fees gradually refined based on risk factors.
- April 2012: Congress levied a10 basis point fee to pay for the Temporary Tax Cut Continuation Act of 2011. Fees accrued to US Treasury not the GSEs.
- December 2012: FHFA directed the GSEs to increase fees an average of 10 basis points. Greater increase on 30-year mortgage fees than 15-year to better align the products. Fees increased more for larger lenders to remove volume fee concessions.
- December 2013: FHFA ordered GSEs to add a 10 basis point fee, change upfront fees based on risk categories and remove Adverse Market Charge in all but four states. The new Director of FHFA reversed order the following month.
- April 2015: FHFA eliminated the Adverse Market Charge, added targeted fee increases for specific loan groups, left the overall level of g-fees unchanged.
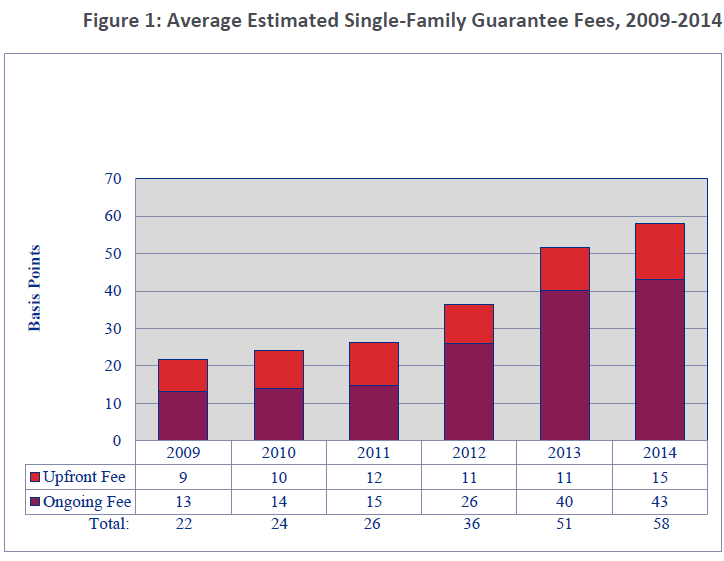
Guarantee fees can be either ongoing or upfront. The former is collected each month over the life of a loan; the latter is a one-time payment made by lenders when a loan is acquired by a GSE. Both compensate the GSEs for providing credit guarantees. The GSEs have relied primarily on upfront fees to reflect differences in risk across loans.
Figure 1 shows average estimated single-family guarantee fee levels from 2009 through 2014 with upfront fees converted to an ongoing basis for ease of comparison. The guarantee fees are currently two-and-a-half times their previous level, up from an average of 22 basis points in 2009 to 58 basis points in 2014. This upward trend reflects both implementation of FHFA’s prior policy to gradually increase fees, and changes in the mix of loans purchased and guaranteed by the GSEs that are subject to different upfront fees based on risk characteristics. The sizeable increases from 2011 to 2014 were driven primarily by the two FHFA-directed increases in 2012.
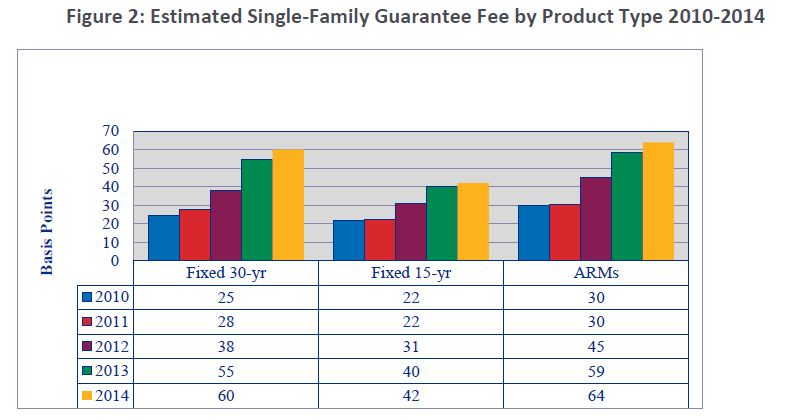
The second of the two 2012 guarantee fees increases implemented risk-based pricing across certain borrower/loan characteristics in two distinct ways. Figure 2 shows that in 2013, fixed-rate 30-year guarantee fees increased by 17 basis points and fixed-rate 15-year fees by 9 and in 2014 30-year fees increased by 5 basis points and 15-year by 2. This later more modest change occurred in 2014 because prior guarantee fee increases were phased in throughout 2013.
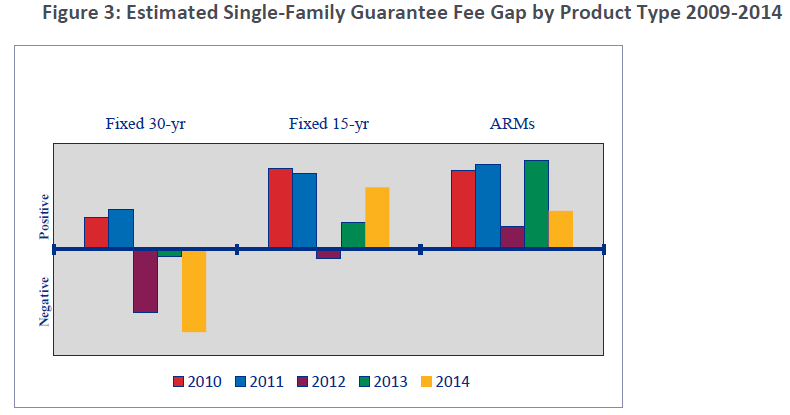
Gap data in Figure 3 show that guaranteeing 15-year fixed-rate mortgages (FRM) was expected to be less costly from 2010 through 2012 than guaranteeing 30-year FRM. By raising the g-fee more on the 30-year FRM than the 15-year in December 2012 profitability differences between the two loans diminished in 2013, although guaranteeing 15-year loans remained slightly more profitable.
Given the fee changes between 2013 and 2014, gaps should have narrowed in 2014 between 30-year loans and 15-year loans. However, as shown in Figure 3, this was not the case and instead these gaps widened significantly. Nonetheless, the return on capital is positive for both GSEs for each of these product types.
Two sets of factors contribute the movement and differences in the gaps over time. First, changes to the credit model and capital-related assumptions can affect gaps and both GSEs imposed a variety of such changes in 2014 that contributed to increasing the credit risk of 30-year FRM relative to 15-year FRM.
Second, as shown in Table 2, the composition of loans both 30-and 15-year FRM purchased by the GSEs changed significantly from 2013 to 2014. The percentage of purchase loans increased significantly while refinance loans decreased. With all risk attributes held constant, purchase loans are historically lower risk than refinance loans. However the proportion of loans in the highest credit sore category also declined in 2014 and there was a significant shift toward higher LTV loans as is expected when rate-term refinancing falls and purchase loans increase. In 2014 there was about a 10 percent decline in the share of both 30- and 15-year FRM in the lowest LTV category with 30-year FRM shifting to the two highest categories and 15-year shifting to the next lowest LTV category thus suggesting a more negative effect for the longer term FRMs. As a consequence of the unequal change and because g-fees are not fully risk-based priced, the 30-year gaps shifted more negative than those for the fixed 15-year loans.
There was also a move to reduce pricing differences between smaller and larger lenders with the December 2012 fee increase. Lenders may deliver loans to the GSEs as a pool and receive a guaranteed MBS containing those loans in return, i.e. an MBS swap. Many lenders subsequently sell the MBS they receive this way in the secondary market. Alternatively, using a second method, a cash window execution, the lender sells a pool of loans directly to the GSE for cash after which the GSE will typically securitize the loans in a guaranteed MBS and sell it. Because of the smaller dollar size of their pools and operational considerations, smaller lenders tend to use the cash window whereas larger lenders tend to engage in MBS swaps.
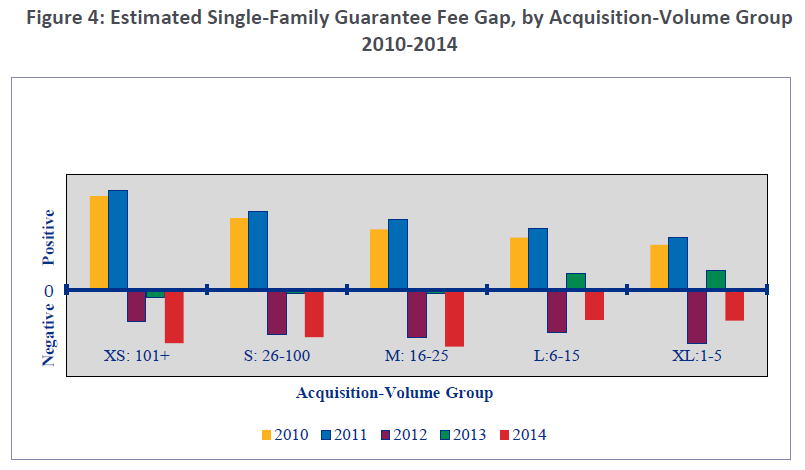
The December 2012 increase raised ongoing guarantee fees more for swaps than for cash window executions. This resulted in a lower average increase in fees paid by small lenders than paid by larger lenders. As Figure 4 shows, in 2013 and 2014 the GSEs expected to profit slightly less on small lender than large lender loans than in the preceding three years when the opposite was true. When categorized by sizes from extra-small to extra-large the percentage of loans purchased by GSEs from extra-small lenders grew substantially in 2014, from 19 percent to 28 percent of overall business.


