
Freddie Mac says that the housing market as a whole in the U.S. is on the outer range of its historic benchmark level of housing activity. The spring homebuying season stayed on course in much of the country and the company's Multi-Indicator Market Index, the MiMi, increased by 0.27 percent from March to April and had a three-month improvement of 1.63 percent. The national MiMi value now stands at 84.1.
On a year-over-year basis, the national MiMi value has improved +7.37 percent. Since its all-time low in October 2010, the national MiMi has rebounded 42 percent, but remains significantly off from its high of 121.7.
The MiMi monitors and measures the stability of the nation's housing markets, on national, state, and top metro levels. Freddie Mac combines its proprietary data with current local market data to assess where each single-family housing market is relative to its own long-term stable range. MiMi takes into consideration home purchase applications, payment-to-income ratios (changes in home purchasing power based on house prices, mortgage rates and household income), proportion of on-time mortgage payments in each market, and the local employment picture to create a composite MiMi value for each market. The company uses MiMi monthly to show where each market stands relative to its own stable range of housing activity and how it is trending, relative to that stable range. A market can fall outside its stable range by being too weak to generate enough demand for a well-balanced housing market or by overheating to an unsustainable level of activity.
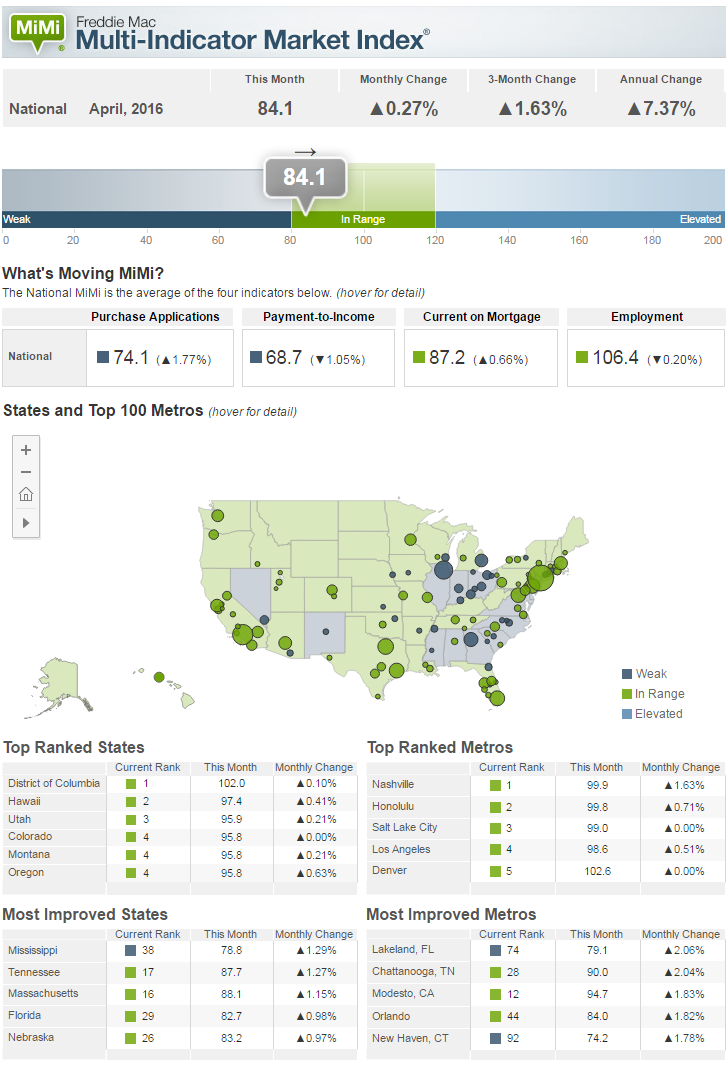
Thirty-six of the 50 states plus the District of Columbia have MiMi values within range of their benchmark averages, with the District of Columbia (102), Hawaii (97.4), Utah (95.9) and Colorado, Montana and Oregon all having the same value (95.8) and being closest to their benchmark averages.
Sixty-seven of the 100 metro areas are within range with Nashville (99.9), Honolulu (99.8), Salt Lake City (99.0), Los Angeles (98.6) and Austin (102.6) ranking in the top five. Two additional metros -- Charlotte and Knoxville -- entered their benchmark ranges during the reporting period.
In April, 42 of the 50 states and 86 of the top 100 metros were showing an improving three-month trend. The same time last year, 46 of the 50 states, and all of the top 100 metro areas were showing an improving three-month trend.
Freddie Mac Deputy Chief Economist Len Kiefer said of the MiMi standings, "Seven years into the recovery from the Great Recession most of the nation's housing markets remain below their historical benchmarks, but continue to grind higher month-by-month. Nationally, MiMi in April 2016, is 84.1, a 7.37 percent year-over-year increase and the 48th consecutive month of year-over-year increases. Over this four-year timeframe, MiMi has increased 36.5 percent and now stands just 15.9 percent below its historic benchmark average.
"Out of the 50 states and the District of Columbia 49 posted positive year-over-year changes. North Dakota and Wyoming, two states heavily reliant on the energy sector, were the only states with year-over-year declines. Out of the 100 metro areas MiMi tracks, 99 posted positive year-over-year gains, with Tulsa, Oklahoma -- also with deep ties to the energy sector -- posting no change year-over-year.
"Among the four MiMi indicators, Purchase Applications increased the most in April, rising 1.77 percent from March and up 15.27 percent year over year. The strong positive momentum in home purchase applications is a good sign for a housing market likely to post the best year in home sales since 2006. Despite strong house price growth, the MiMi Payment-to-Income indicator fell 1.05 percent in March, reflecting the impact of lower mortgage rates. If global factors like the Brexit put significant downward pressure on long-term mortgage rates, the U.S. housing market could benefit from increased affordability, helping to partially offset the impact of house prices, which are rising around six percentage points year over year nationally."


