
The two sets of price indices released on Tuesday diverged again. The S&P CoreLogic Case-Shiller Indices continue to show declining appreciation while the Federal Housing Finance Agency's (FHFA's) House Price Index (HPI) indicates that price increases, while lower than at the peak, are still maintaining a strong pace.
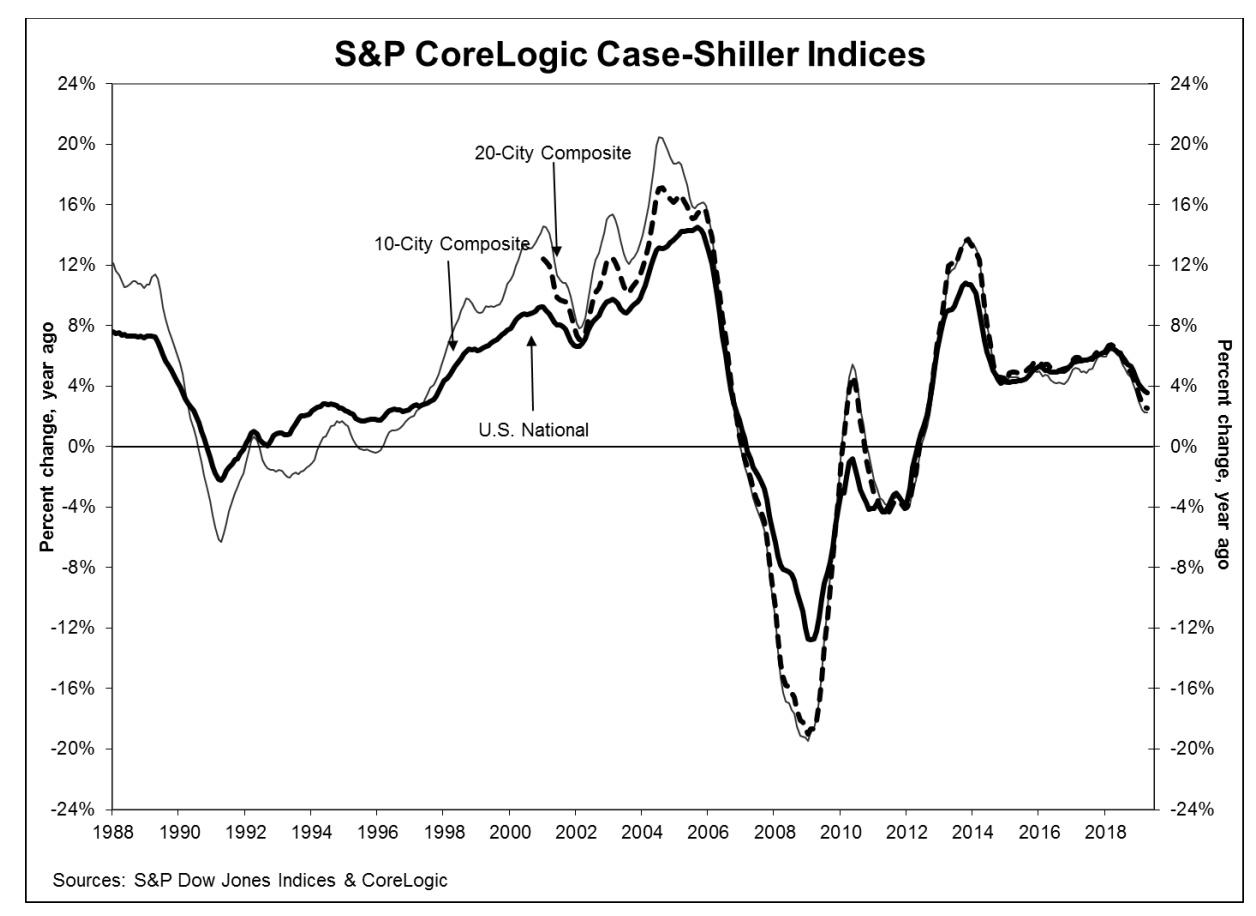
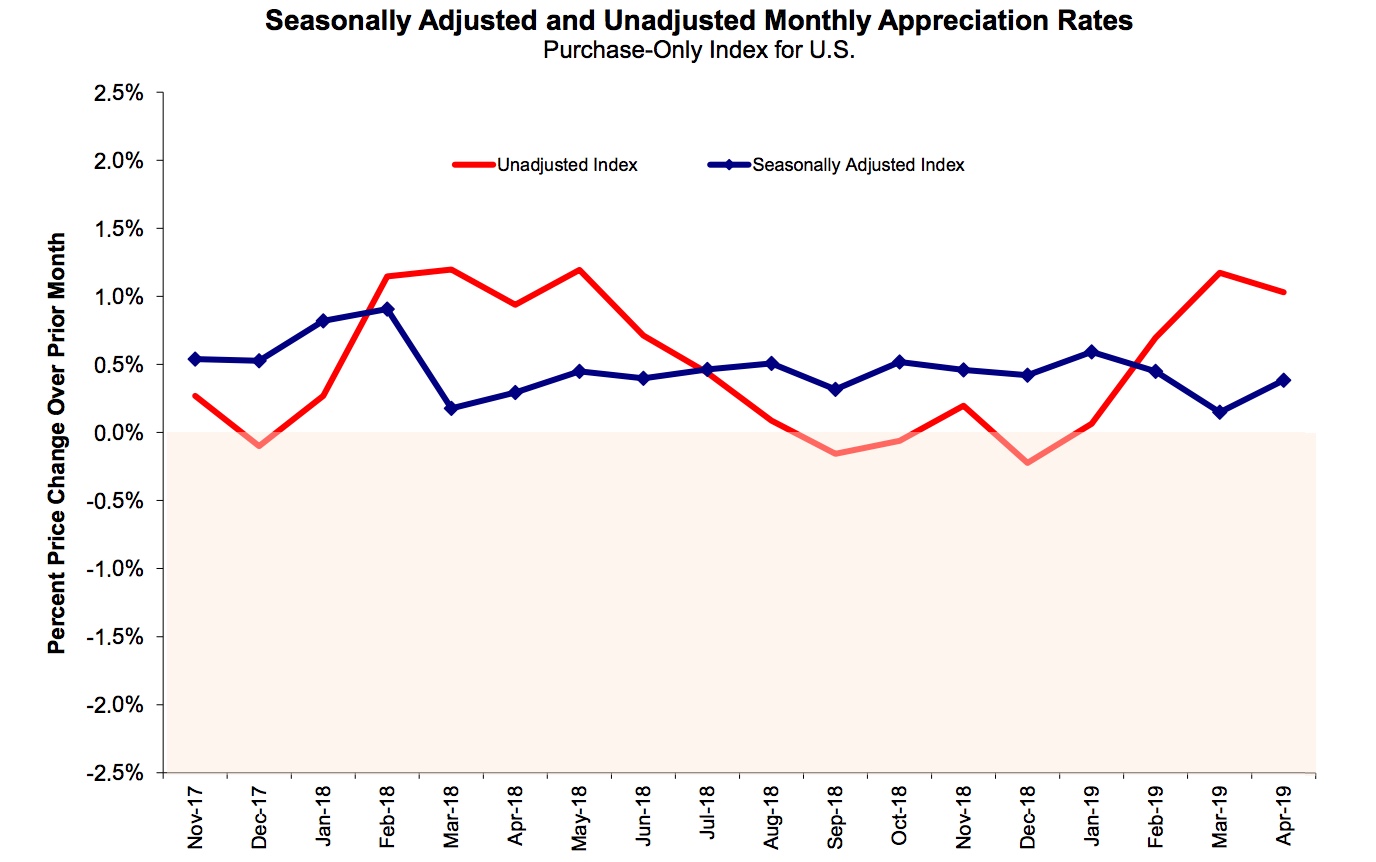
The Case-Shiller U.S. National Home Price non-seasonally adjusted (NSA) Index which covers all nine U.S. census divisions, increased by 3.5 percent on an annual basis in April compared to year-over-year growth of 3.7 percent in March. The index posted a gain of 0.9 percent on an unadjusted basis from the previous month and 0.3 percent appreciation after adjustment.
The 10-City Composite Index increased 2.3 percent on an annual basis compared to 2.2 percent the previous month while to 20-City Composite's year-over-year gain was 2.5 percent, down from 2.6 percent in March. Both composites had NSA month-over-month increase of 0.8 percent while the 10-City SA monthly increase was 0.2 percent and the 20-City was unchanged from March. In April 19 of 20 cities reported increases before seasonal adjustment, while 14 cities reported increases after seasonal adjustment.
Las Vegas, Phoenix and Tampa continue to top the list of cities in terms of appreciation. Las Vegas led with a 7.1 percent 12-month change, followed by Phoenix, up 6.0 percent and Tampa at 5.6 percent. Nine of the 20 cities reported greater price increases in the year ending in April versus the year ending in March.
Philip Murphy, Managing Director and Global Head of Index Governance at S&P Down Jones Indices provided the following analysis.
"Home price gains continued in a trend of broad-based moderation. Year-over-year price gains remain positive in most cities, though at diminishing rates of change. Seattle is a notable exception, where the YOY change has decreased from 13.1 percent in April 2018 to 0.0 percent in April 2019.
"The national average 30-year fixed mortgage rate rose from below 4 percent in late 2017 to briefly reach almost 5 percent by the latter part of 2018. Peak YOY changes in the 20-City Composite coincided with the upward turn in mortgage rates during the first quarter of 2018. In 2019, mortgage rates reversed course again and the 30-year fixed mortgage rate is again under 4 percent, yet the YOY house price moderation that coincided with the 2018 uptick in rates has not changed course. Other industry statistics are consistent with this observation. For example, the national supply of housing is trending upward and suggesting weaker demand. Perhaps the trend for the moment is toward normalization around the real long run average annual price increase. Comparing the YOY National Index nominal change of 3.5 percent to April's inflation rate of 2.0 percent yields a real house price change of 1.5 percent - edging closer to the real long run average of 1.2 percent cited by David Blitzer last month."
All three of the Case-Shiller indices are above their levels when prices peaked in the summer of 2006. The National Index has exceeded its peak by 12.6 percent while the 10-City and 20-City Composites are up 1.2 percent and 4.4 percent respectively.
FHFA reported an increase of 0.4 percent in its April HPI compared to March. This is up from the monthly increase reported in March of 0.1 percent. On an annual basis, home prices rose 5.2 percent, a slight increase from the 5.1 annual appreciation reported for March.
For the nine census divisions, seasonally adjusted monthly house price changes from March 2019 to April 2019 ranged from -0.6 percent in the West North Central division to +1.2 percent in the Mountain division. The 12-month changes were all positive, ranging from +4.0 percent in the Middle Atlantic division to +7.8 percent in the Mountain division.
The HPI is calculated using home sales price information from mortgages sold to, or guaranteed by, Fannie Mae and Freddie Mac. The index was benchmarked to 100 in January 1991. The April 2019 reading was 274.7
The S&P CoreLogic Case-Shiller Home Price Indices are constructed to accurately track the price path of typical single-family home pairs for thousands of individual houses from the available universe of arms-length sales data. The National U.S. Home Price Index tracks the value of single-family housing within the United States. The indices have a base value of 100 in January 2000; thus, for example, a current index value of 150 translates to a 50 percent appreciation rate since January 2000 for a typical home located within the subject market.
As of April 2019, the National Index was at 207.97, up from 206.23 in March. The 10- and 20-City Composites had readings of 229.06 and 215.68 respectively, compared to 227.57 and 214.09 the prior month. Los Angeles has the highest index at 284.54 and Cleveland the lowest at 123.18.


