
The third major home price indicator of the month was released on Monday and again there was no indication that the rate of appreciation is slowing. Black Knight Financial Services said prices, as measured by its National Home Price Index (HPI) increased from March to April by 1.2 percent. The index reading of $275,000, was the highest in the HPI's history. The month-over-month increase in the index has brought prices up 3.6 percent since the first of the year, with the bulk of that growth, an aggregate of 2.5 percent, coming in March and April.
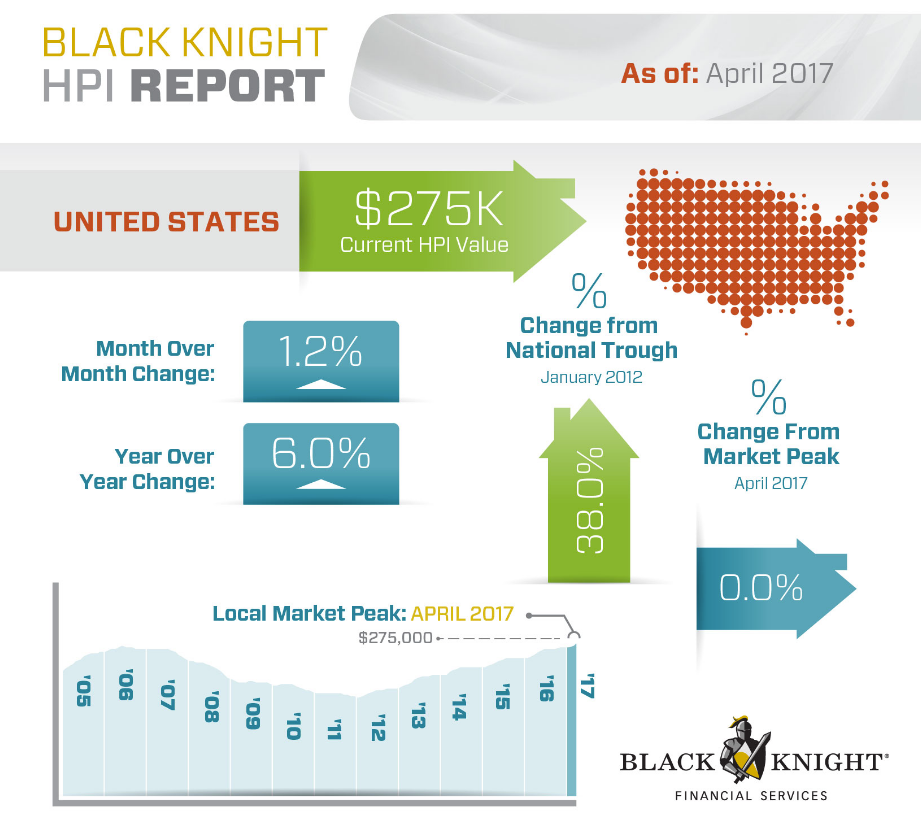
On an annual basis, the index gained 6.0 percent in April, compared to of 5.8 percent in March. The average year-over-year increase was 5.6 percent in the first quarter of 2017 and 5.4 percent for all of 2016.
Washington State continues to outperform other states; its 2.1 increase from March led the nation for the third straight month. Oregon followed with appreciation of 1.9 percent followed by four states with 1.8 percent gains; Nevada, New Jersey, Michigan, and Montana. Even the worst performing states managed to eke out an increase; West Virginia was up 1.0 percent, Mississippi and Wyoming 0.2 percent, and Maine, South Dakota and Kansas each were up 0.4 percent
The strongest gains among metro areas were Seattle and Bellingham, Washington and Carson City, Nevada, all with 2.3 percent monthly gains. Washington state accounted for five of the nation's top 10 best performing metros
Tuscaloosa, AL was the only metro area to see a decline. Prices fell another 5.1 percent for its fifth consecutive month as the country's worst-performing metropolitan area
Among the 20 largest states tracked by Black Knight, nine hit new peaks in April - Indiana, Massachusetts, New York, North Carolina, Pennsylvania, Tennessee, Texas, Washington and Wisconsin. Since the market his bottom in January 2012, prices nationally have recovered by 38 percent.
April marks 60 consecutive months of annual national home price appreciation


