
The National Association of Realtors today released Existing Home Sales data for May 2011.
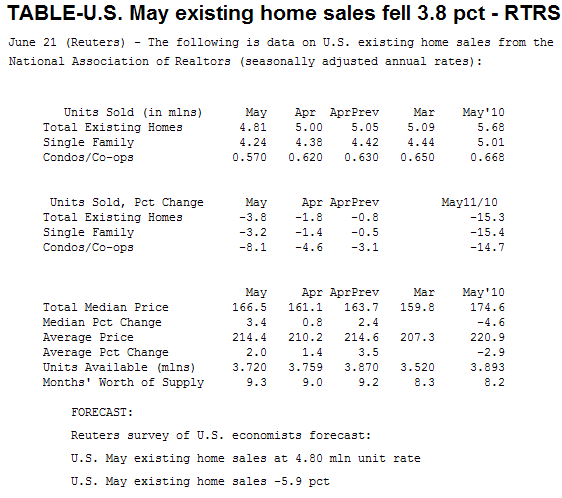
Existing Home Sales declined by 3.8 percent to a seasonally adjusted annual rate of 4.81 million in May from a negatively revised 5.00 million pace in April. This is 15.3 percent below the 5.68 million annual pace reported last May (*when sales were surging to beat the deadline for the home buyer tax credit). All regions saw annual contractions in both the pace of home sales and median prices. And while total housing inventory was reduced by 1.0 percent to 3.72 million previously owned homes for sale, it's now going to take longer to sell those homes because the annualized pace of sales declined to 4.81 million. That works out to 9.3-months of supply, up from 9.0-months of supply in April. FYI: Supply of between six and seven months is viewed as an equilibrium range. Higher readings general point to lower home prices to better balance supply and demand.
Existing-home sales were down in May as temporary factors and financing problems weighed on the market, according to the National Association of Realtors®. Lawrence Yun, NAR chief economist, said temporary factors held back the market in May, as implied from prior data on contract signings. "Spiking gasoline prices along with widespread severe weather hurt house shopping in April, leading to soft figures for actual closings in May," he said. "Current housing market activity indicates a very slow pace of broader economic activity, but recent reversals in oil prices are likely to mitigate the impact going forward. The pace of sales activity in the second half of the year is expected to be stronger than the first half, and will be much stronger than the second half of last year."
Excerpts from the Release...
Existing-home sales, which are completed transactions that include single-family, townhomes, condominiums and co-ops, fell 3.8 percent to a seasonally adjusted annual rate of 4.81 million in May from a downwardly revised 5.00 million in April, and are 15.3 percent below a 5.68 million pace in May 2010 when sales were surging to beat the deadline for the home buyer tax credit.
Single-family home sales declined 3.2 percent to a seasonally adjusted
annual rate of 4.24 million in May from 4.38 million in April, and are
15.4 percent below a surge to 5.01 million one year ago. The median
existing single-family home price was $166,700 in May, down 4.5 percent
from May 2010.
Existing condominium and co-op sales fell 8.1
percent to a seasonally adjusted annual rate of 570,000 in May from
620,000 in April, and are 14.7 percent below the 668,000-unit pace in
May 2010. The median existing condo price was $165,400 in May, which is
5.8 percent below a year ago.
There were notable regional differences in home sales. “A large decline in Midwestern existing-home sales can be attributed partly to the flooding and other severe weather patterns that occurred, but this also implies a temporary nature of soft market activity,” Yun explained.
Regionally, existing-home sales in
the Northeast declined 2.5 percent to an annual level of 770,000 in May
and are 13.5 percent below May 2010. The median price in the Northeast
was $241,500, up 6.1 percent from a year ago. Existing-home sales
in the Midwest dropped 6.4 percent in May to a pace of 1.02 million and
are 22.7 percent below a year ago. The median price in the Midwest was
$136,400, which is 8.5 percent below May 2010. In the South,
existing-home sales fell 5.1 percent to an annual level of 1.85 million
in May and are 14.4 percent below May 2010. The median price in the
South was $149,200, down 3.1 percent from a year ago.
Existing-home
sales in the West were unchanged at an annual pace of 1.17 million in
May but are 10.0 percent lower than a year ago. The median price in the
West was $192,300, which is 12.6 percent below May 2010.
“Home prices are rising or very stable in local markets with improved employment conditions, such as in North Dakota, Alaska, Washington, D.C., and many parts of Texas,” Yun noted.
The national median existing-home price for all housing types was $166,500 in May, down 4.6 percent from May 2010. Distressed homes – typically sold at a discount of about 20 percent – accounted for 31 percent of sales in May, down from 37 percent in April; they were 31 percent in May 2010.
“The price decline could be diminishing, as buyers recognize great bargain prices and the highest affordability conditions in 40 years; this will help mitigate further price drops,” Yun said.
All-cash transactions stood at 30 percent in May, down from 31 percent in April; they were 25 percent in May 2010; investors account for the bulk of cash purchases.
First-time buyers purchased 35 percent of homes in May, down from 36 percent in April; they were 46 percent in May 2010 when the tax credit was in place. Investors accounted for 19 percent of purchase activity in May compared with 20 percent in April; they were 14 percent in May 2010.
Total housing inventory at the end of May fell 1.0 percent to 3.72 million existing homes available for sale, which represents a 9.3-month supply at the current sales pace, up from a 9.0-month supply in April.
Yun said the market also is being constrained by the lending community. “Even with recent economic softness, this is a disappointing performance with home sales being held back by overly restrictive loan underwriting standards,” he said. “There’s been a pendulum swing from very loose standards which led to the housing boom to unnecessarily restrictive practices as an overreaction to the housing correction – this overreaction is clearly holding back the recovery.”
When calling attention to high gas prices and severe weather Yun is referencing the economic connection between Consumer Confidence and housing demand. We have described this relationship as the "negative feedback loop". This is what we wrote in August 2010 after the home buyer tax credit expired in June....
This should come as no surprise to folks working in the industry. Uncertainty is abundant in all sectors of the economy and prospective (qualified) homeowners are too worried about further declines in home prices to buy a house right now. When investing outlooks are unusually cloudy and the market's strategic perspective is stuck in the "here and now", a brutal negative feedback loop can arise. Some may refer to this phenomenon as a "downward spiral", where negative data leads to more negative data.
Plain and Simple: Although mortgage rates are at all-time lows and home affordability is at an all-time high, fence sitting home buyers are waiting for proof that home prices have hit bottom before making the biggest investment decision of their life. While they wait for a clear cut buy signal, home prices will fall further and home buyer pessimism will intensify which will lead to more weak housing data. And the downward spiral begins...
We could go on and on about the industry, lender, and borrower specific problems limiting the housing recovery, however we believe the general big picture economic environment is providing enough roadblocks to recovery on its own. Thus, we will continue to state that until the labor market stabilizes and jobs start being created, the housing market will undergo a slow, frustrating recovery process (for mortgage and real estate professionals especially)
Some Optimism: Nationally, housing faces a long road to recovery, but not all markets are equal. While areas with a high concentration of distressed properties are clearly stuck in a deflating scenario, some communities will see price stability. It's all based on local and regional economies. Where are jobs being created? Where are the best schools? Where is value being created by the community? Where do buyers want to live? This is where the housing recovery can find momentum. Of course you need to be in the right financial situation to even be asking these questions. That's another problem all together...
NAR President Ron Phipps, broker-president of Phipps Realty in Warwick, R.I., said a number of proposals being considered in Washington could further jeopardize the housing recovery. “We’re concerned about the flow of available capital, including a possible rule that would effectively raise minimum downpayment requirements to 20 percent,” he said. “We don’t need to throw the baby out with the bath water – increasing downpayment requirements would effectively shut many qualified families out of the market. What we critically need is a return to the basics of providing safe mortgages to creditworthy buyers willing to stay well within their budget.”
ABOUT: Existing Home Sales report on the number of completed real estate sales transactions on single-family homes, townhomes, condominiums and co-ops. The methodology in calculating existing-home sales statistics is really quite simple. Each month the National Association of Realtor® receives data on existing-home sales from local associations/boards and multiple listing services (MLS) nationwide. The monthly EHS economic indicator is based on a representative sample of 160 Boards/MLSs. NAR captures 30-40% of all existing-home sale transactions with its monthly survey. HERE is the methodology for the data collection


