Americans are sitting on a nearly unprecedented level of untapped wealth - or maybe sitting IN it is more to the point. A report from Black Knight notes the first quarter of this year saw the "tappable" equity Americans have in their homes rose at what could be a record pace. The company says tappable equity growth is a different metric than simple equity growth as it is the amount that homeowners can actually use. That is, it is the amount of a home's value that can be borrowed against before reaching a combined loan-to-value (CLTV) ratio of 80 percent.
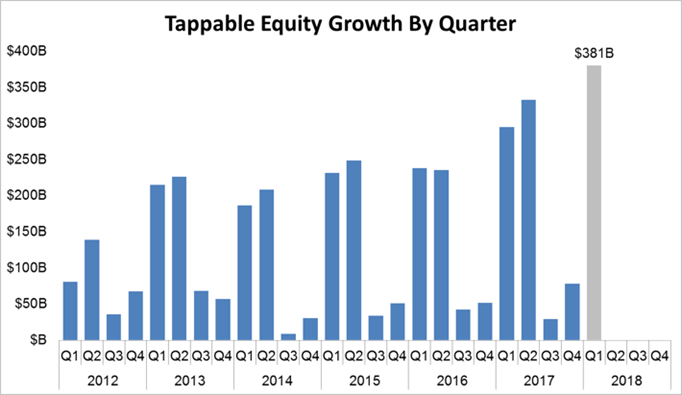
Tappable equity grew by $380 billion in the first quarter of 2018. That 7 percent increase is the largest single quarter growth in Black Knight's records, which go back to 2005. Equity growth is usually greatest in the first and second quarters of each year, but the first quarter growth this year was nearly 30 percent greater than the same quarter in 2017. And, as the chart below shows, second quarter growth has exceeded first quarter growth for five of the last six years.
Homeowners nationwide have a total of $5.8 trillion in tappable equity and that number has increased by 16.5 percent or $820 billion over the last 12 months. The total is the highest ever recorded and is 16 percent higher than at the previous peak of home prices in mid-2006.
Another report earlier this month, this one from CoreLogic put total equity at $15 trillion. This was an increase of $544 billion during the first quarter and $544 billion year-over-year.
This equity growth is, or course, being driven by rising home prices. Black Knight puts that growth at 2.5 percent in just the first three months of this year. This works out to an increase of $6,900 for the median priced home in the first quarter and $14.700 compared to the first quarter of 2017. The average homeowner has $113,900 in tappable equity. As we will see in a minute however, those averages are misleading.
A decline in LTV's also plays a role; the national average is now 52 percent. CoreLogic pointed out that the growth in mortgage debt turned negative in 2008 and remained so until 2015 and has increased only slowly since then. From the first quarter of 2017 to the first quarter of this year it grew by $280 billion, much more slowly than home values. It is now estimated at $10.1 trillion.
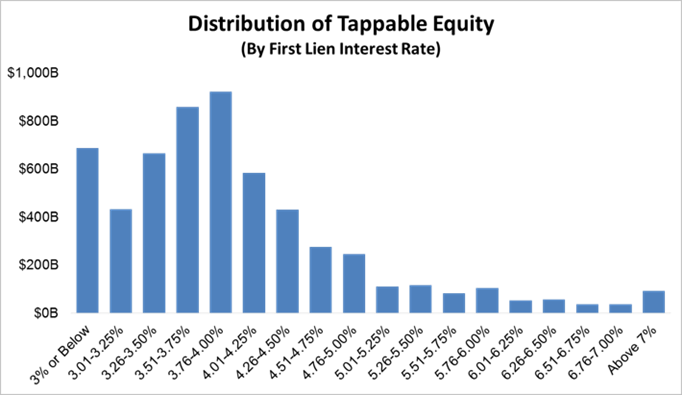
Black Knight says nearly 70 percent of the equity gain in the first quarter is tappable, assuming a cap of 80 percent in combined CLTV. However, there is a significant disincentive for equity-rich homeowners to refinance. Nearly 80 percent of the total tappable equity is held by homeowners who hold first mortgages with interest rates below 4.5 percent and 60 percent is held by homeowners whose mortgages rates are below 4.0 percent.
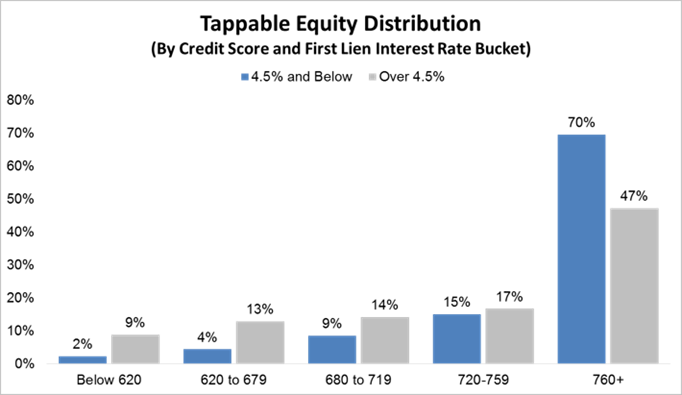
This should be an attractive market for lenders' offering home equity lines of credit or HELOCS. Not only do these homeowners have significant equity and first mortgages they may be reluctant to give up, but 70 percent of homeowners with interest rates below the current levels have credit scores above 760.
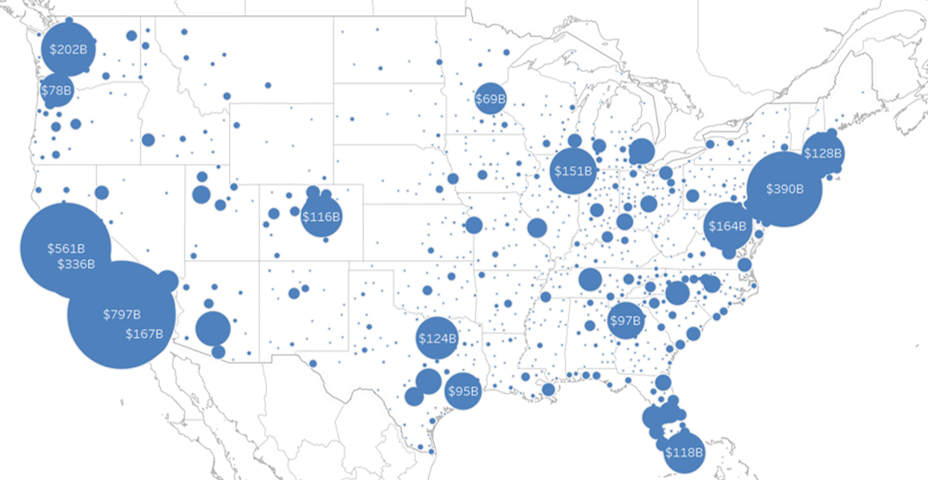
However, as stated earlier, the wealth represented by increasing equity is very unequally distributed. San Jose, for example, has seen the average mortgaged home gain $191,500 in tappable equity in the last year, more than twice the average in any other market. The metro area is estimated to have the 4th largest pool of such equity in the country, $336,000 billion, despite being the 34th largest metro in population. The average per mortgaged homeowner is $695,000.
As can be seen from the map below, several other California cities as well as other area on both coasts, in Texas, and a few in the Midwest have benefitted disproportionately from the rise in equity, while in most parts of the country there have been considerably lower gains, or none at all.