
There are four housing indexes that the country looks to for information on the state of the market. According to a report from Standard & Poors (S&P), none of them, either individually or in the aggregate, provide a full picture of what, is going on, a possible concern because of the reliance of both government and industry on these reports to form and react to policy decisions.
S&P says that the four reports, The Federal Housing Finance Authority (FHFA) Purchase-only Index, First American CoreLogic's LoanPerformance Index, the National Association of Realtors®(NAR) Median Home Price Index, and the S&P/Case-Shiller Index; each collect data at least somewhat differently, and the data lags the reporting month by an average of 60 days. "Consequently," the report says, "we believe it's no easy task to get a consistent view of the sector's health, and it's not uncommon for market participants to form different opinions about what they think the future will hold in the housing market."
The financial services company maintains the stance that there is an inherent sampling bias in the reports because they include homes with values determined through an actual sale while excluding those without any hard price information or even excluding only one price observation. This ultimately skews sample selection which may lead to instability in home price changes from month to month. "In the absence of other alternatives, however, it's likely that the market will continue using home index values as rough benchmarks for long-term behavior rather than to form opinions based on short-term patterns."
S&P provides the following in order to characterize the four indices.
These indices use repeat sales of the same houses to calculate changes in home prices. The index "family" includes 20 regional indices and two composite indices aggregated across metropolitan areas. The 10-City Composite Home Price Index is a value-weighted average of the 10 "original" metropolitan area indices and the 20-City Composite similarly evaluates all 20 metro areas.
The indicates were assigned a base value of 100 in January 2000, so an value of 120 today would indicate a 20 percent appreciation in the typical home's value. The indices are calculated monthly and published with a two-month lag. The calculations include homes purchased with non-conforming loans which brings more expensive properties into the sample and uses actual sales prices rather than appraised values to derive its numbers.

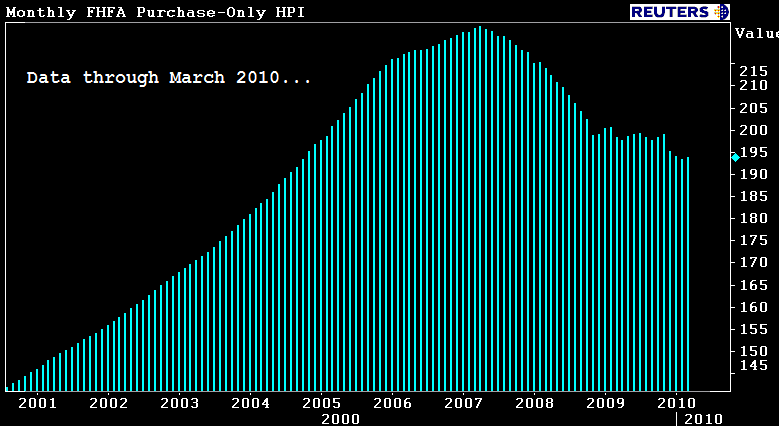
FHFA Purchase-Only Home Price Index
This monthly index measures paired repeat sales of single family homes. A larger FHFA index includes refinancing in its calculations while the Purchase-Only index eliminates appraised values. All sales included in the index are backed by GSE-backed mortgages. By excluding non-conforming jumbo mortgages the index may understate deterioration. It also excludes mortgage transactions on attached and multi-unit properties and properties financed by government guaranteed loans.
The index includes home prices in nine Census Bureau divisions across 50 states and the District of Colombia. Because of the recent increase in government-backed mortgages the coverage of the index has increased and it is becoming a broader barometer of current housing prices.
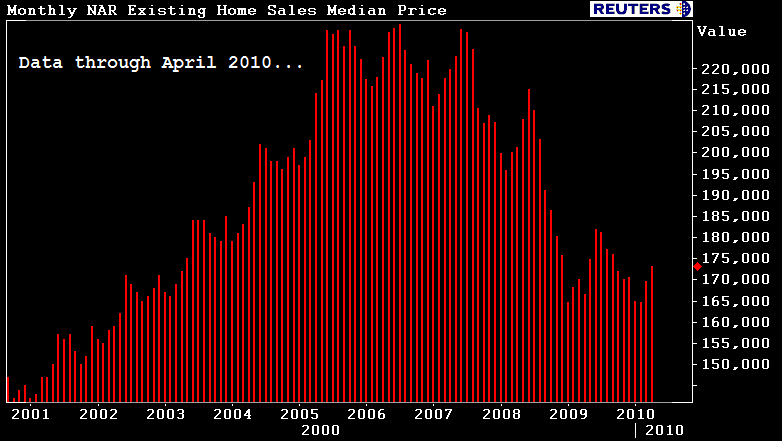
NAR Existing Home Sales Median Price
The NAR index measures the median sale prices for existing homes in 20 metropolitan statistical areas. The information is gathered from local Realtor associations and nationwide multiple listing services. S&P says that the median home price calculation is easy to understand but the sample selection bias causes the mix of homes to shift over time.
LoanPerformance Home Price Index
This index shows home price behavior based on market-only sales and on combined sales using market and distress sale data, thus providing an insight into the impact of distressed sales. The methodology uses repeat sales over a 30 year database to track changes over time. It covers 6,173 ZIP codes, 569 core-based statistical areas, and 1,016 counties in all 50 states and the District of Colombia.
S&P notes the advantages and drawbacks of some of the characteristics in each database and methodology. Because they are calculated from past sales prices, there is an unsystemic risk aspect to the four indices. They reflect the influence of local issues such as unemployment income growth, land supply and demand and local regulations. The more forward looking equity indices tend to reflect current and future systemic risks in the economy. The report said that, while approaches differ, many real estate observers prefer the repeat sales method to assess home price changes. In practical application, the Loan Performance and S&P/Case-Shiller indices warned of a price decline much earlier than the FHFA index.
Despite month-to-month divergence, the indices generally show similar trends over the long run. Their volatility, however, varies over time because of the location and types of loans covered, loan limits, data sources, and selection basis.
Those indices that are based on repeat sales are most widely used to measure home price behavior but they are also often revised as additional sales become available. The median price methodology suffers the most from sampling selection bias as the mix of homes in the sample shifts over time. This shift may also affect the repeat sales-based indices.
Because the S&P/Case-Shiller indices are broken down in three price tiers, it is possible to spot trends within the tiers. Those indices as well as the FHFA index highlight how home prices changes have varied considerably across their respective universes.


