
As the value of residential real estate rises with home prices, so has the owner's equity share of that value. Jing Fu, writing in the National Association of Home Builders' (NAHB) Eye on Housing Blog, says that equity hit a new high in the first quarter of this year.
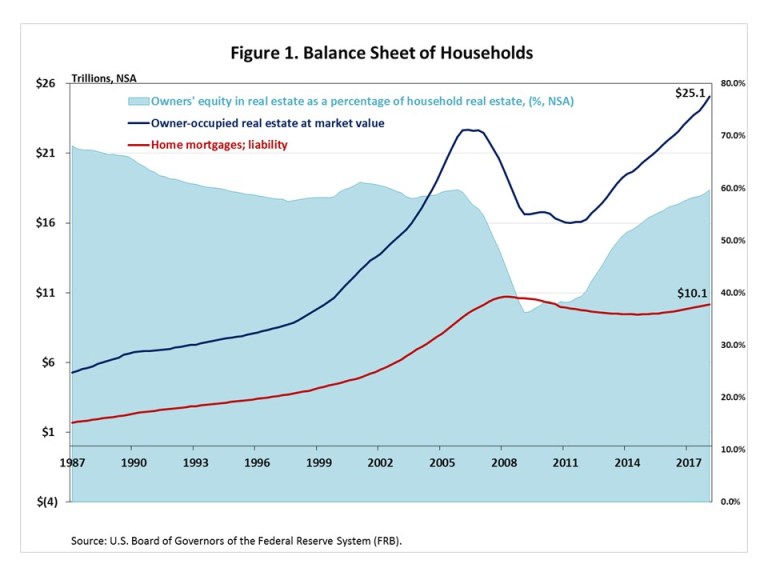
Fu uses figures from the Federal Reserve's Board of Governors' Financial Accounts of the U.S. to show the overall nominal, non-seasonally adjusted value of owner-occupied housing units in the nation grew to $25.1 trillion during the quarter. This is an increase of $544 billion from the total in the fourth quarter of 2017 and $1.674 trillion more than the first quarter of last year.
At the same time, the growth of mortgage debt fell negative in 2008 and remained so until early 2015. It has risen only modestly since then. Its was estimated at $10.1 trillion in Q1 2018, up $280 billion year-over-year. This enabled owners' equity, the difference between debt and value, to rise by $1.4 trillion since the first quarter of 2017, reaching $15.0 trillion, a new record high in the same quarter of 2018. As a percentage of value, owner equity increased to 59.7 percent from 58.9 percent in the fourth quarter of last year.
Fu says the Mortgage Bankers Association's (MBA's) first quarter National Delinquency Survey (NDS) puts the delinquency rate for mortgage loans on one-to-four unit residential properties at a seasonally adjusted rate of 4.63 percent, 8 basis points lower than a year earlier, and the serious delinquency rate down to 1.47 percent. The decrease in the percentage of loans that were 90 or more days past due or in foreclosure indicates that the modest uptick in mortgage debt is the result of new mortgage originations.
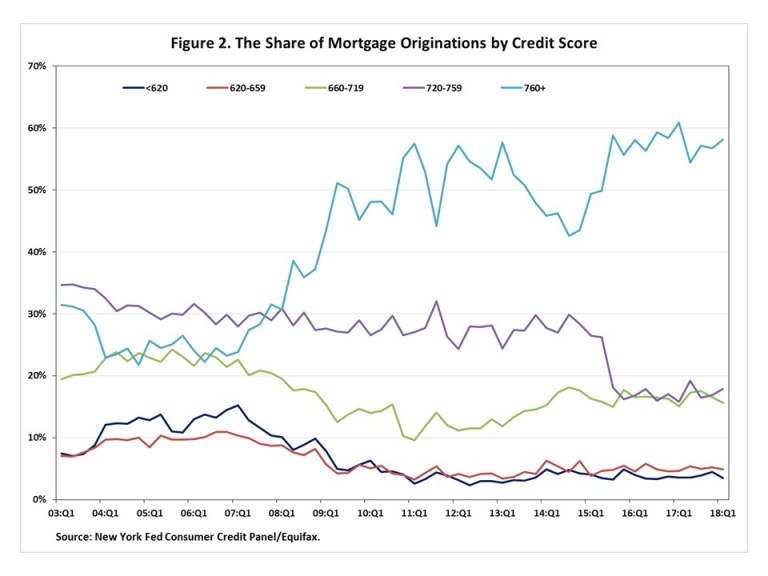
But Fu's point is the borrowers who are getting those new loans. According to the New York Federal Reserve, total mortgage origination volume declined by 12.9 percent, from $491.4 billion in the first quarter of 2017 to $427.9 billion a year later. Figure 2 shows that the share of mortgage originations ranked by credit score has changed over time. Before 2007 the share of mortgage originations with a credit score equal to or exceeding 760 was less than the ones in the 720-759 credit score range and was similar to the share of those in the 660-719 credit score range. Meanwhile, over the same period, mortgage originations in the 620-659 credit score range and the ones with a credit score less than 620 accounted for about 9% and 11%, on average.
During the past eleven years, the share of originations among households with scores over 759 climbed sharply from 24 percent in Q1 2007 to 58 percent this year. Over the same period the share of mortgage originations for households with a relatively good credit score (720-759) has shrunk, widening the gap between it and the higher share among top scores.
This indicates that a large share of new mortgages goes to those with the strongest credit scores while the leverage in the overall market, measured by the loan-to-value (LTV) ratio, appears to be falling as home values grow faster than mortgage debt. However, on the margin, leverage (the ratio at home purchase) is likely growing. Fu says, these numbers indicate that, on average, those with the strongest credit scores can obtain a high amount of mortgage credit relative to the value of their home, and, in addition to house price appreciation, they also generally pay down their mortgage debt in a timely fashion. More subtly, it suggests that credit tightness restricts those that can get a mortgage, but not the amount that can be borrowed if they are able to obtain one.


