
Delinquencies on home equity lines of credit (HELOCs) have increased on an annual basis twice in the six months ended in March according to Black Knight Financial Services. These were the first such increases since June 2012 and, along with the amortization status of a large number of these loans, have occasioned the company to take a look at HELOCs in its June Mortgage Monitor.
HELOCs originated in 2005 comprised about 17 percent of all active HELOCs at the beginning of 2015, the year in which these loans ended their so-called open periods. Homeowners could no longer draw down on unused portions of their open lines of credit and the loans themselves switched from interest only to fully amortizing loans. The percentage of HELOCs represented by 2015 loans has subsequently dropped to 13 percent.
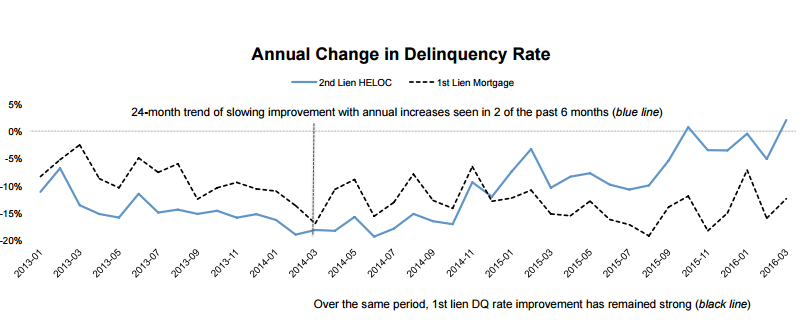
HELOC delinquency rates were down in the first three months of 2016 by 19 basis points (bps) compared to the same period in 2015 but the March 2016 rate was 4 bps higher than March 2015. HELOC delinquencies increased by 6 bps from October 2015 to November and by 8 bps from December to January. While the increases are small, they stand out in the context of overall mortgage performance. The decline in first lien delinquencies has remained strong over the last 12 months, averaging a 15 percent year-over-year decline.
The increase in past due HELOC payments is being driven almost entirely by the 2005 vintage of loans. Delinquencies there have spiked by 87 percent and the large numbers of these loans are more noticeably affecting the overall rate for HELOCs. Black Knight says that up to 8 months ago the improved performance of other vintages had masked the increases in vintages where the draw period had ended, but over the past 3 years there has been a very consistent 90 to 92 percent increase in delinquencies in each vintage in the 15 months following this event.

The 2006 vintage represents 17 percent of active loans and the 2008 vintage another 18 percent so Black Knight says we can anticipate the trend of increasing delinquencies to continue over the next two years as the open periods for these loans end. The delinquency rate for loans originated in 2006 has already seen a slight increase, up 5 bps in the first quarter of the year while in prior years the noticeable rise has occurred in April and May. However, the low interest rate environment can probably be credited for a higher prepayment rate for the 2006 vintage over the previous 12 months than was seen for 2005 loans and similar activity may be seen for the 2007 vintage as its open period nears an end.
Leveraging both loan-level mortgage performance and multiple listing service (MLS) data, Black Knight also examined the correlation between mortgage characteristics and the likelihood a property will be listed and/or sold. The chart below indicates that the share of mortgaged properties listed for sale in March was down 5 percent from the previous March and 22 percent from 2012.
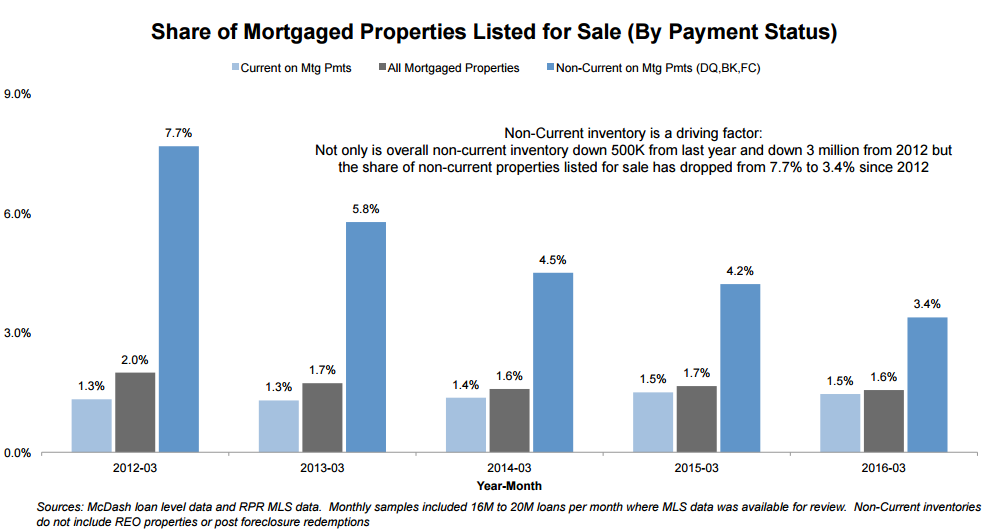
Borrowers who are behind in their mortgage payments are over twice as likely to list their properties for sale than those who are current. As of March the overall non-current inventory is down 500,000 from a year earlier and down 3 million from March 2012. Moreover, the share of non-current mortgaged properties listed has declined from 7.7 percent four years ago to 3.4 percent. Declines in non-current inventory and non-current listing share have been a driving factor in the overall decline in mortgaged properties listed for sale.
Black Knight says the share of borrowers that are current on their mortgages and have those properties listed for sale is relatively flat compared to last year and up 10 percent from 2012, "but that increase hasn't been enough to overcome the decline in non-current listings, contributing to a further tightening of inventory."
Black Knight Data & Analytics Senior Vice President Ben Graboske pointed out that past-due status is not the only mortgage-related explanation for the tight inventories. "People with adjustable-rate mortgages are more likely to list their homes than those with fixed rates, which is hardly surprising given that buyers often choose ARMs when they plan to stay in their homes for less time. Interestingly, borrowers with low fixed interest rates - 4.25 percent or below - are less likely to put their homes on the market than those with higher rates. This is something to keep an eye on if and when interest rates begin to rise. Should the trend hold true, rising interest rates could put an even greater strain on an already tight housing inventory."
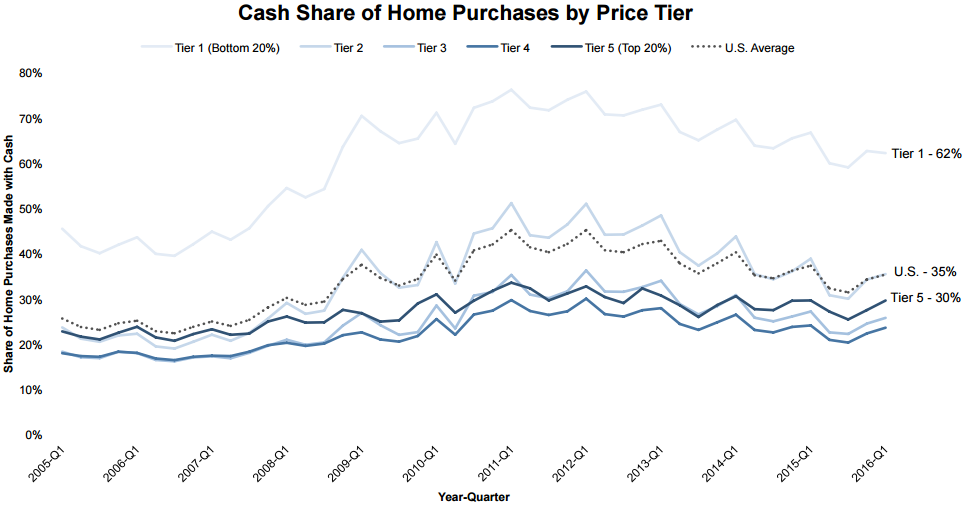
The Monitor also looked at the percentage of cash sales by home price tier. Cash sales have declined nationwide as the inventory of distressed properties has dried up. Cash sales represented 45 percent of home purchase transactions in 2011 and 35 percent in the first quarter of this year and declined by 2 percentage points over the previous year. The current level is still well above the pre-crash Q1 level of 25 percent in 2005 through 2007.
The Monitor says there is a clear disparity in cash sales by home price tier. Sales of homes in the top 20 percent by value had a cash sales rate of 30 percent while those in the lowest 20 percent tier were 62 percent all-cash. This disproportionate share (the next lowest tier has only a 35 percent share) is down from 75 percent at the bottom of the housing market but is still historically high.
Graboske commented, "The prevalence of cash sales at the low end of the market can likely be chalked up to two primary factors. First, negative equity is still higher than average among this segment of the market, resulting in increased distressed discounts for buyers. Second, lower-priced homes simply require less capital to purchase outright, making cash sales possible for more people."
However, the disparity between the high and low tiers in the proportion of cash sales doesn't always hold. Black Knight reports that there were 9 Core Based Statistical Areas with at least 2000 recorded home sales in which there was a larger share of cash sales at the high end than at the low. Seven of these were in California.
This suggests, the report continues, that rather than buying distressed or low priced properties at a discount, buyers in these markets are likely using cash as an advantage in hotter markets. For example, in San Francisco prices are now 13 percent above the 2006 and homes in the highest price tier are 27 percent higher. Cash sales represent 28 percent of the top tier and 25 percent of the bottom tier. In Salinas the 50 percent share of high priced homes paid for in cash is twice the percentage at the bottom.


