
There is easy money, which in mortgage lending terms would be exemplified by underwriting standards in the 2005-2008 period, and there is tight money, the state of mortgage lending in the years immediately thereafter. Where does underwriting stand today? Archana Pradhan writes in CoreLogic's Insight blog that the answer depends on the standards that are examined.
Compared to the period immediately after the crash, guidelines have clearly been loosening. Pradhan points out that Fannie Mae upped the maximum loan-to-value (LTV) ratio of loans it would accept to 97 percent in December 2014, a moved followed by Freddie Mac a few months later. Last July Fannie raised its maximum debt-to-income (DTI) level from 45 to 50 percent.
DTIs and LTVs, along with credit scores, are the most important factors in mortgage underwriting and have shown dramatic variation in the last 18 years. The recent moves by Fannie and Freddie (the GSEs) to loosen credit policies have helped to boost the levels of both ratios. Looking only at conventional conforming (CC) home purchase loans, those that generally meet standards for sale set by Fannie Mae and Freddie Mac and which make up about 70 percent of the U.S. mortgage market, Pradhan provides the following analysis.
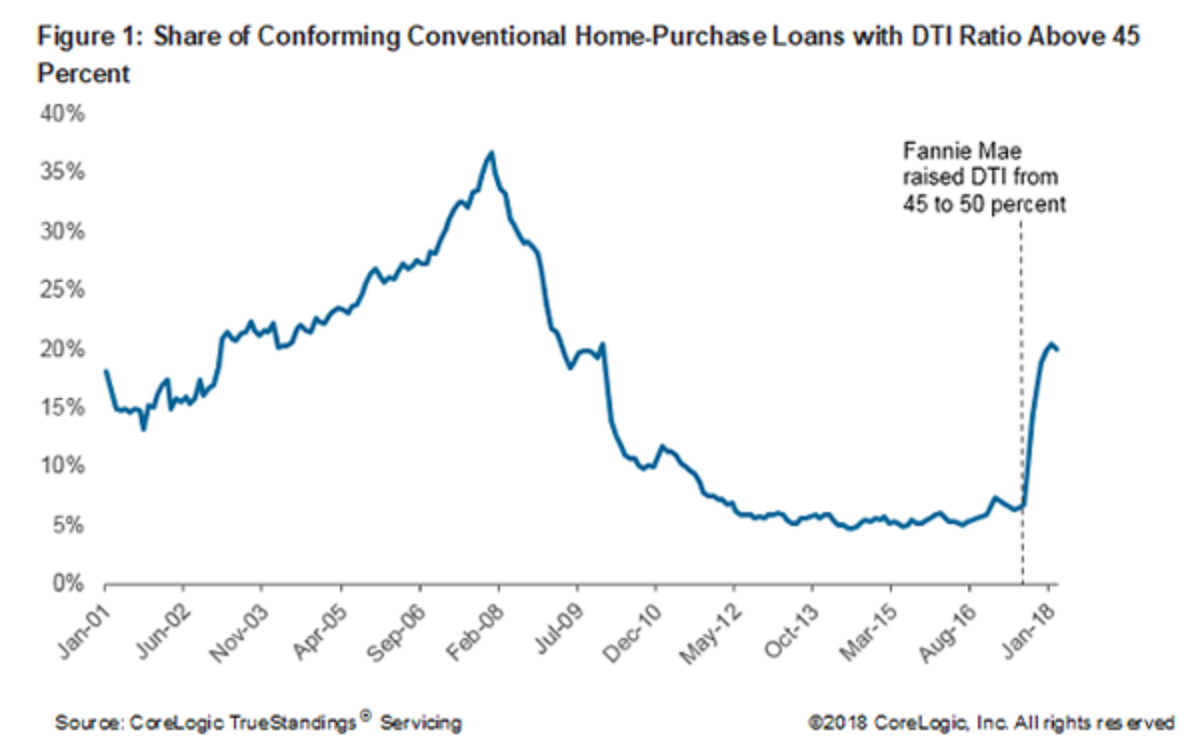
Figure 1 shows the share of new conventional conforming home-purchase loans with DTI ratio above 45 percent rising sharply after Fannie Mae's move. The share, holding steady at between 5 percent to 7 percent from early 2012 up to Fannie Mae's announcement, climbed to 20 percent of loans originated Q1 2018, although still well below the over 35 percent with such ratios pre-housing crisis. The average DTI ratio for CC home-purchase loans rose from 35 percent in the first quarter of 2017 to almost 37 percent in the same quarter this year.
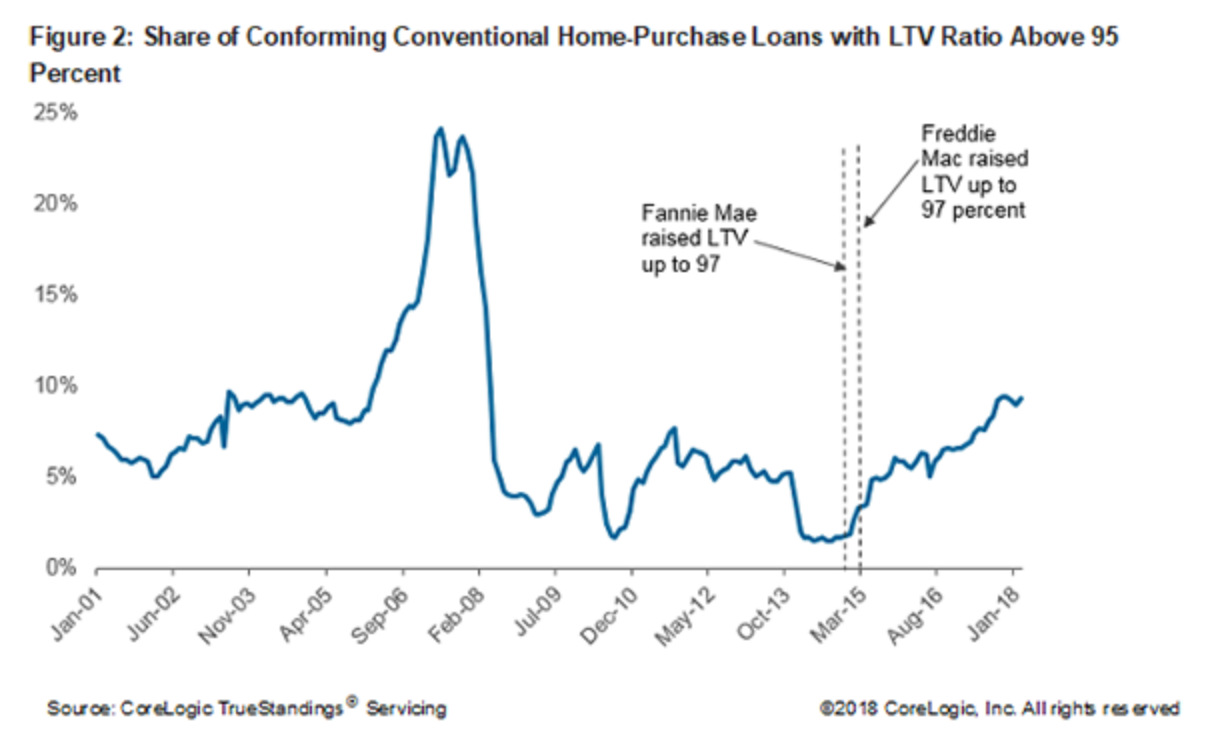
The change was less dramatic for higher LTVs, but the share of those with levels over 95 percent did begin to rise in early 2015, shortly after Fannie Mae's policy change. From less than two percent in 2014 it rose gradually, reaching 9 percent in Q1 2018. Still, the average LTV ratio for the home-purchase loans in Q1 2018 was unchanged from Q1 2017 at 82 percent.
The third factor, credit scores, have not changed. The average score for homebuyers taking CC home purchase loans held steady at 755 in the first quarters of both 2017 and 2018. This is considerably higher than even pre-bubble levels. For example, the average score in 2001 was 705.
But Pradhan points out these three borrower attributes are not the only risk factors in mortgage lending. The prevalence of low or no-doc lending, investor loans, and condo-coop lending are also indications of tight vs easier standards.
Figure 3 compares all six indicators of underwriting and credit risk using the 2001-2001 period as a benchmark period. The blue hexagon represents an index of credit-risk attributes in that period with each set equal to 100. The red polygon represents characteristics of loans made in the first quarter of 2018 relative to their benchmarks.
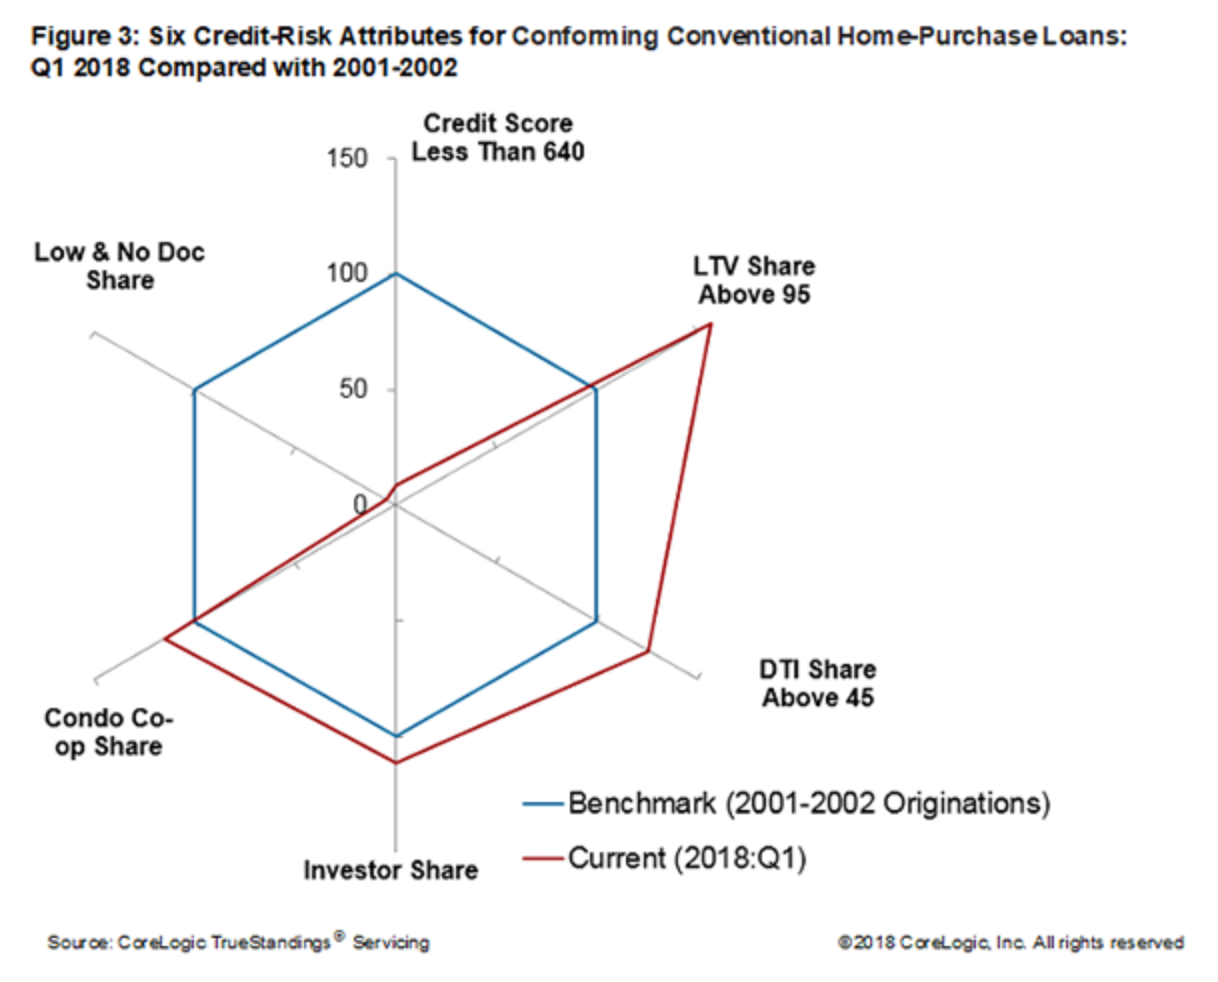
The share of borrowers with a credit score less than 640 as well as the low- and no-doc share were both down significantly compared to the benchmark level. In contrast, the shares of new loans with an LTV higher than 95 percent and with a DTI above 45 percent were 57 percent and 26 percent higher respectively than the benchmark level. The condo/co-op share was 15 percent higher, while the investor-owned share was 11 percent higher than the benchmark level.
Pradhan says her data indicates that underwriting continues to be cautious but is loosening slightly across most of the attributes of credit risk.


