
It should come as no surprise that the rise in interest rates that occurred after the November 2016 election had a profound impact on mortgage originations, especially those for refinancing. Black Knight Financial Services, in its current Mortgage Monitor report, said first lien mortgages were originated during the first quarter of 2017 at the lowest rate since the fourth quarter of 2014.
Overall, $372 billion such loans were originated, a 9.0 percent decline from the corresponding quarter in 2016 and down 34 percent from the fourth quarter of that year. Refinancing plummeted 45 percent from the previous quarter and was off by 20 percent on an annual basis.
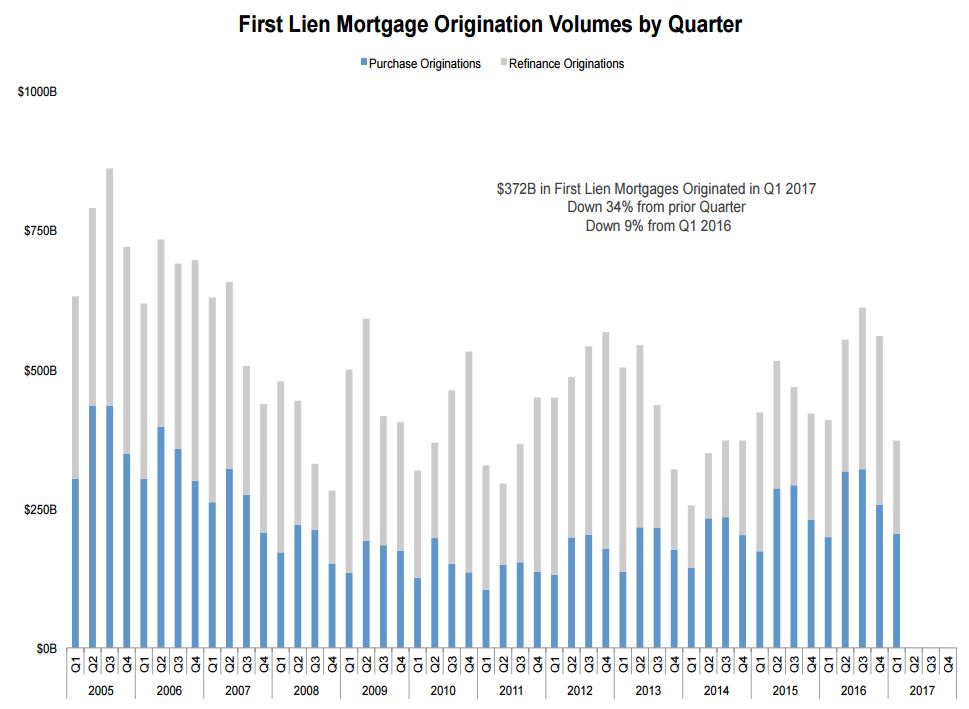
Purchase originations, while up 3.0 percent year-over-year, fell 21 percent quarter-over-quarter. Black Knight noted that while purchase origins did post an annual increase it was far below the 12 percent year-over-year gain in the fourth quarter of 2016. Black Knight Data & Analytics Executive Vice President Ben Graboske noted that, while the first quarter is historically the calendar year low for such lending, this decline probably had its roots in increasing rates.
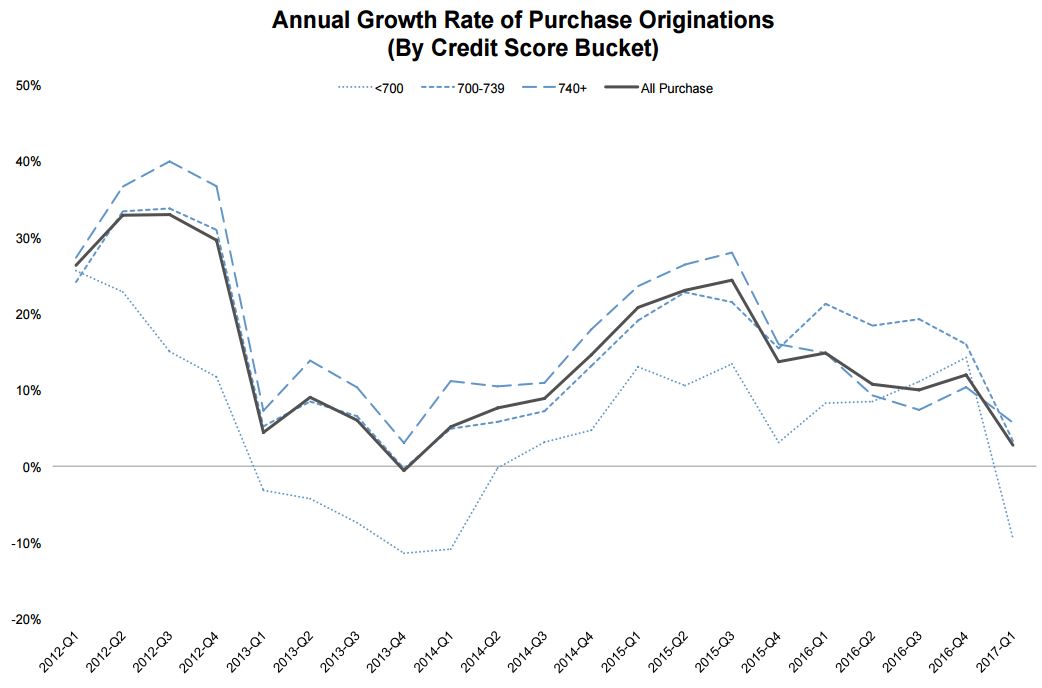
The sharp decline in purchase originations ended a nine-quarter streak of double digit annual increases and was the second lowest gain, following the fourth quarter of 2013, since the housing recovery began. During that period, the annual change was negative, down 1 percent. Graboske said, at that point in time, interest rates had risen abruptly - very similarly to what we saw at the end of 2016 - and originations slowed considerably. "The same dynamic is at work here," he said.
Purchase originations in the under 700 credit score bucket showed the sharpest deceleration and was the only segment with a year-over-year decline, down 9.0 percent. High credit score borrowing, originations to borrowers over 740, were least impacted and continued to lead all credit segments in growth.
Refinances have lost considerable market share. In the last quarter of 2016 they accounted for 54 percent of originations. In the following period that dropped to 45 percent.
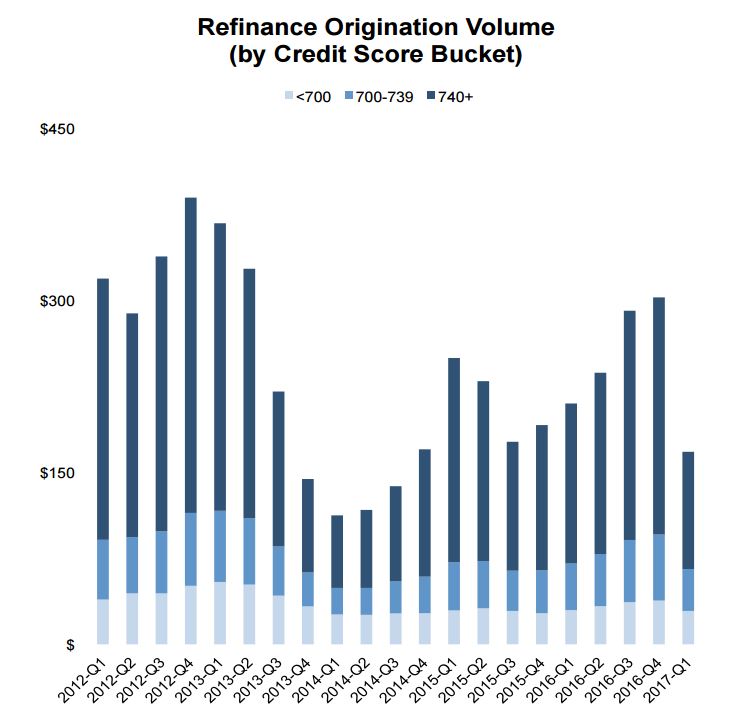
The decline in refinance originations was most pronounced among the borrowers with the highest credit scores, over 740. Activity there declined by 50 percent. There were also fewer refinances originated at the other extreme; the volume of activity among lower score borrowers, those below 700, declined 24 percent.
Graboske said, "Refinance lending among higher credit score borrowers, who have largely driven the refinance market these past several years, saw a quarterly decline of 50 percent. As we've seen in the past, these borrowers tend to strike quickly and often when interest rate incentives are present, but tend to hold back when the conditions are less favorable.
The Monitor noted a net lowering of credit score for refinancing as well. The average score in the first quarter was 742, down from 751 in the previous period and the lowest average since the third quarter of 2014.
There has been much written in the last year or so about the lack of for-sale inventory and the impact it is having on home sales and on home prices. The Monitor noted an interesting correlation among interest rates, home prices, and for-sale listings.
First, home prices surpassed their pre-crisis peak for the first time in February, then indices saw their largest month-over-month gains in nearly four years in March. That month also marked the 59th month in which prices had appreciated on a national basis (HPA) and Black Knight's Home Price Index (HPI) is now 1.5 percent higher than at the 2006 peak.
Washington State leads the country in HPA, with annual appreciation of 11.6 percent, nearly 2 percentage points higher than Oregon and Colorado, numbers two and three. Those two states, however, have seen a slowing in HPA over the past two months. Wyoming and Alabama are the only two states in which annual prices have declined slightly year-over-year.
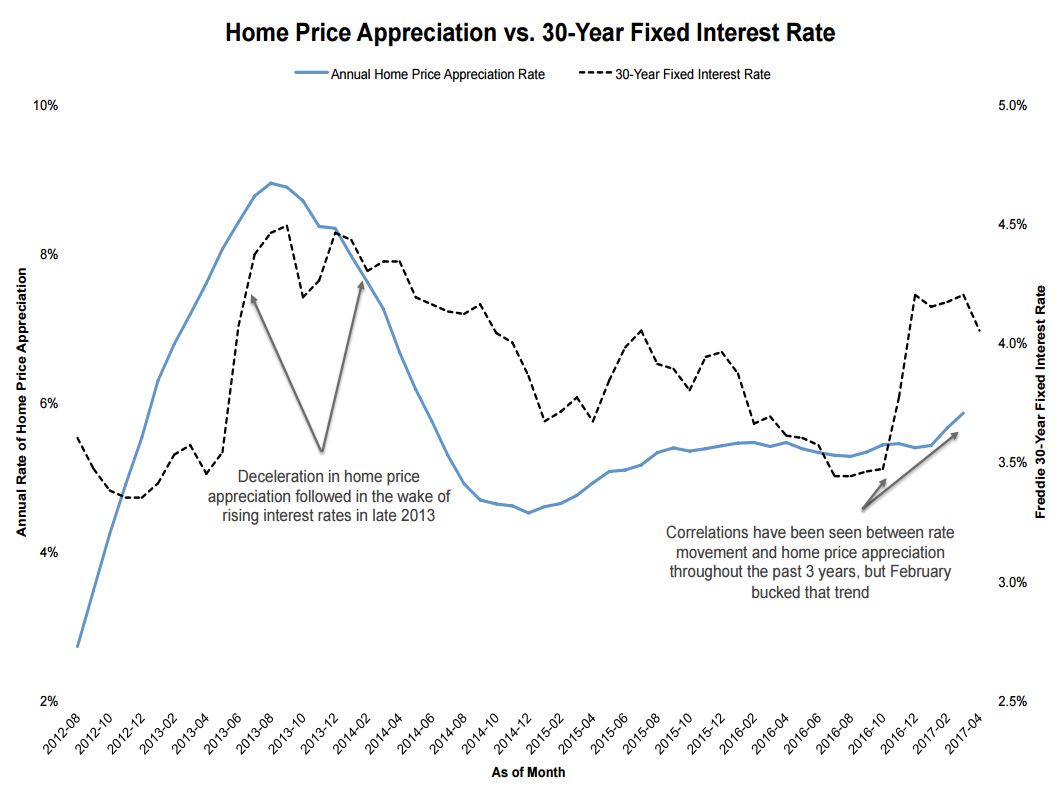
But now there appears to be a disruption in the correlation of HPA and interest rates. In recent years the two have moved in an inverse relationship although a minimal one. (The exception is the late 2013 period noted above in the discussion of purchase mortgages. At that time, the HPI decelerated rapidly as rates rose.) However, in February and March the HPA started to accelerate alongside rising interest rates. Forty states saw HPA accelerate from January to February and there was further acceleration in 30 states from February to March. That suggests, the Monitor says, that the tight inventories are temporarily outweighing the impact of higher interest rates on affordability.
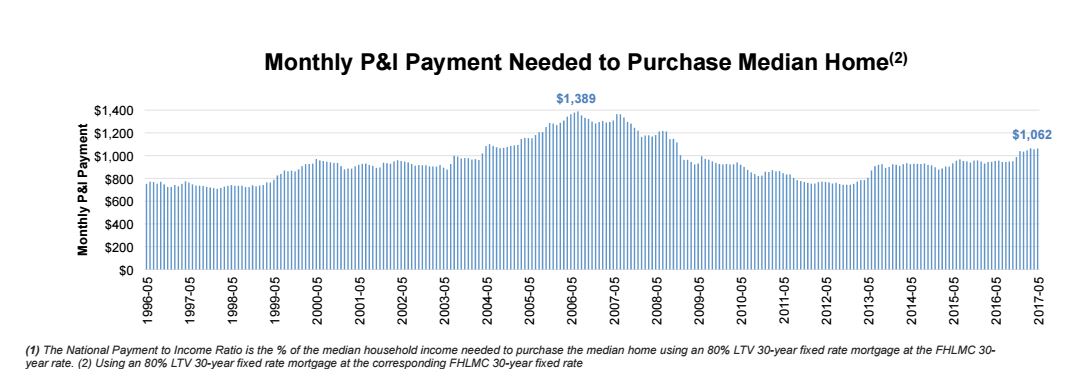
Despite recent softening of rates, they fell by about 33 basis points from March to April, home affordability remains near a post-recession low, and the share of the median income necessary to make principal and interest payments on a median priced home is at a post-recession high of 22.6 percent. The recent pull-back of rates would have a net impact of reducing that cost by $32 per month or adding $11,000 more in buying power with the same monthly payment. However, rising home prices are eating into those savings, taking away about half since the first of the year.
Still homes remain more affordable than before the housing crisis. In 2006, it required about 35 percent of median income to purchase a median priced home, and in the five years leading up to that peak the average was 26.7 percent.
But back to inventories. Black Knight says there are mortgage characteristics that appear to be contributing to their current record lows.
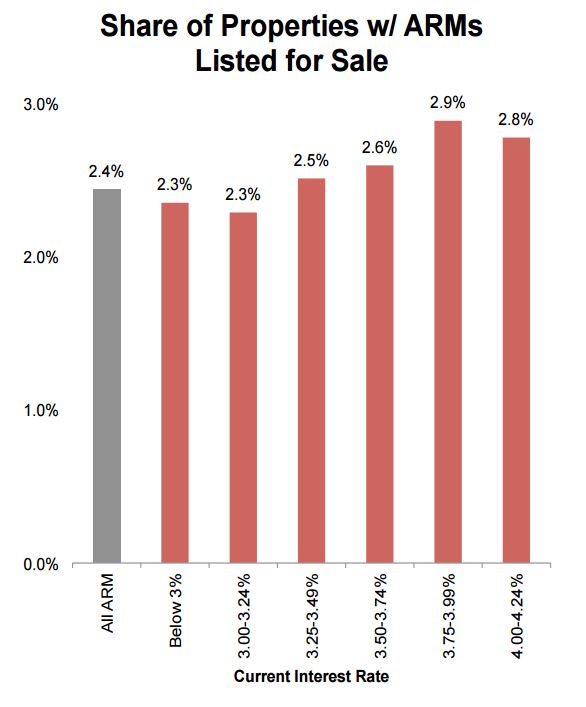
The company found that properties with adjustable rate mortgages (ARMs) are listed for sale at a higher rate per capita than those with fixed rate mortgages (FRMs). However, because rates have been low for so long, the number of active ARMs are at the lowest point since 2002.
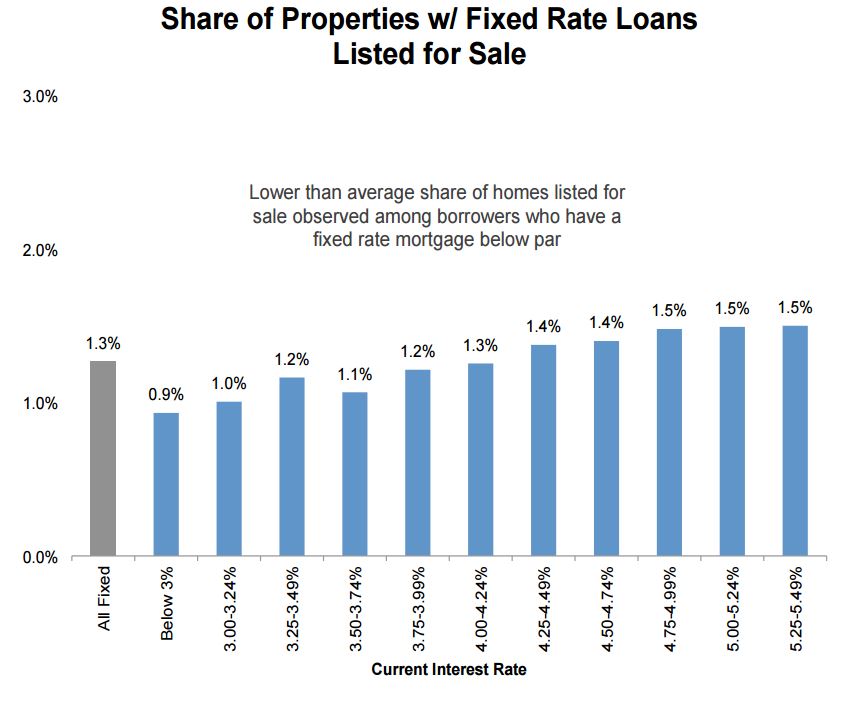
In this same vein, among properties with fixed-rates, there is a correlation between interest rates and the chance a house will be put on the market. Home carrying higher rates are being listed more often. With roughly 40 percent of active mortgages today having a rate below 40 percent, it is easy to see why homeowners may be somewhat reluctant to sell and possibly take on a higher interest rate.
Under the heading of mixed blessings, a significant reduction in the number of distressed properties available for sale is also contributing to the tight inventories. Owners who are behind on their mortgages are much more likely, again per capita, to put their homes on the market. At the bottom of the market (2009-2012) nearly 40 percent of homes for sale had delinquent mortgages; today that has fallen to 10 percent. In terms of volume, during that period there was an average of more than 100,000 distressed (bank owned or short sales) properties sold each month. Today that number is 25,000. The share of non-distressed homeowners who list their homes has increased since that time, but this isn't enough to offset the disappearance of distressed home listings.


