As the current issue of Black Knight's Mortgage Monitor was going to "press" mortgage rates dropped under 4.0 percent for the first time in more than a year. Black Knight spokesperson Mitch Cohen says the decline to 3.99 percent sent what the company considered the refinanceable population of homeowners up by 2 million in just a month and a total of 3 million in two months. Black Knight considers refinanceable homeowners as those who can both qualify for refinancing and would save at least 75 basis points by doing so. The company now counts 5.9 million potential refinancing candidates in that pool, the largest group in nearly three years. The figure below shows the distribution of potential refinance candidates across origination vintages as of mid-May, prior to the most recent pullback in rates.
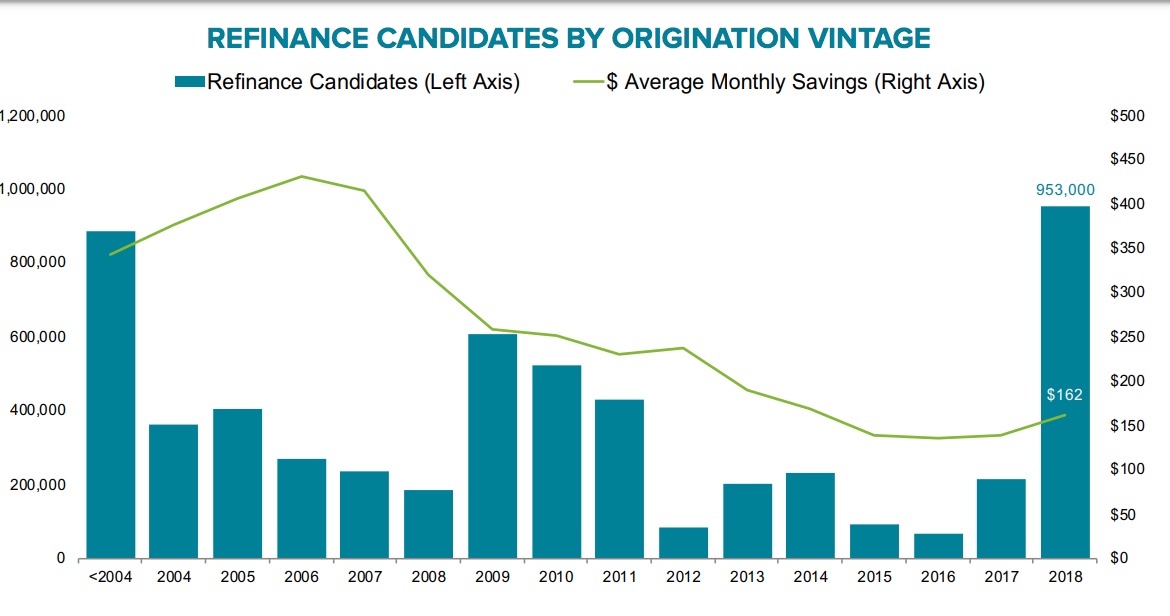
Today those borrowers could achieve an aggregate of $1.6 billion in monthly savings, an average of $271 per household. Nearly 1 million of these borrowers took out their mortgage last year. That vintage represents a greater potential for early payoff than the 2012 to 2017 vintages combined, but also the greatest business potential.
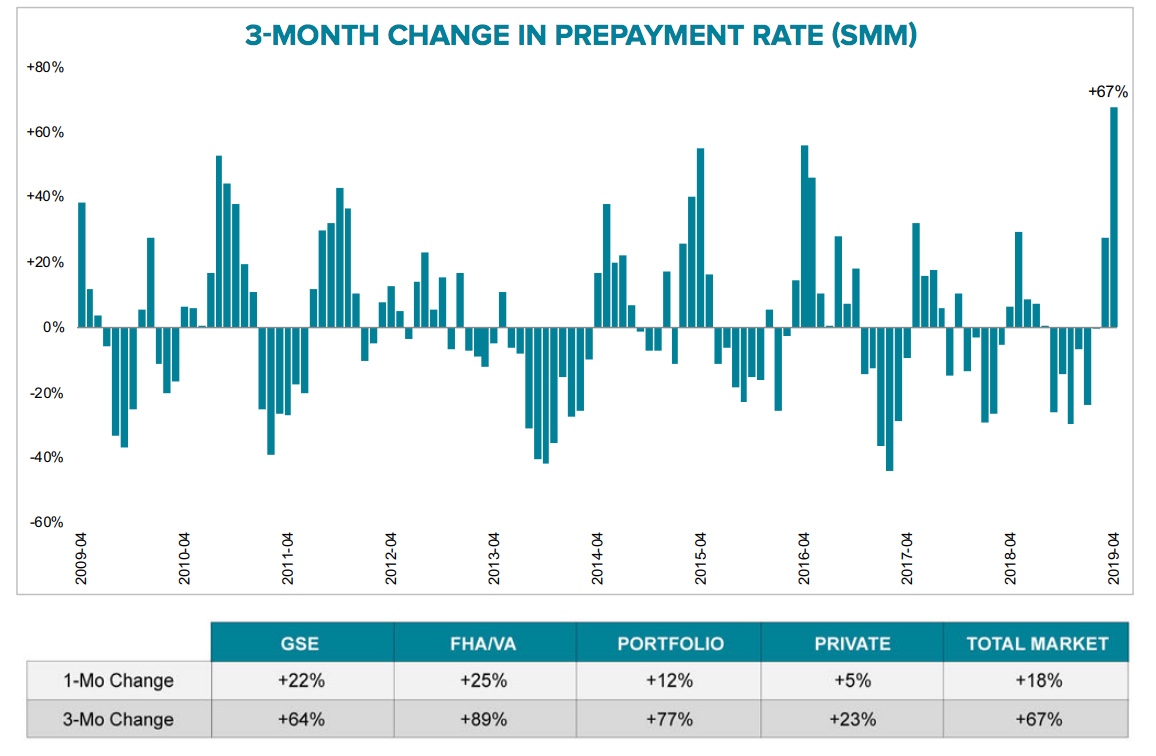
The most recent rate drop hasn't had time to percolate through the system and be reflected in prepayment statistics, but the easing of rates that began last November is definitely being felt. Black Knight notes that April, the month examined in the current Mortgage Monitor, marked the third consecutive month in which the prepayment or single month mortality rate (SMM) increased. It is now up 67 percent over those months, the largest increase in more than 10 years. Of course, not all of the prepayments are rate-related, 'tis the season for home sales and those accounted for more than half of the increase (about 89 percent over the three months) in FHA and VA loan prepays. Despite the surge in prepayments, the total SMM rate of 0.99 percent is below the 5-year average of 1.04%.
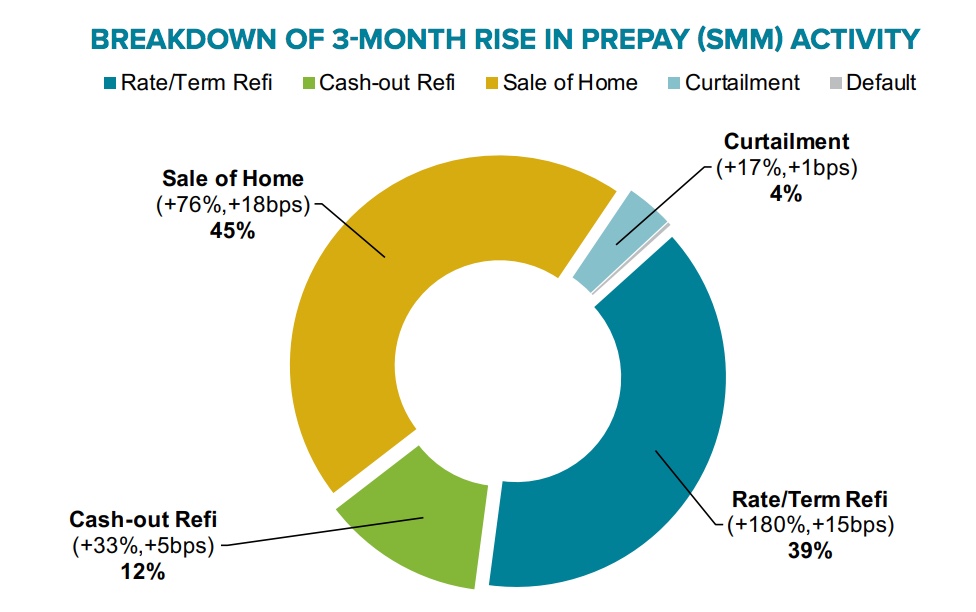
Prepayments due to rate/term refinances have grown by 180 percent over the last three months and are now five times their rate in November of last year when interest rates peaked and the highest since October 2017. The largest share of the increase is due to the seasonal jump in new home sales, accounting for 45 percent.
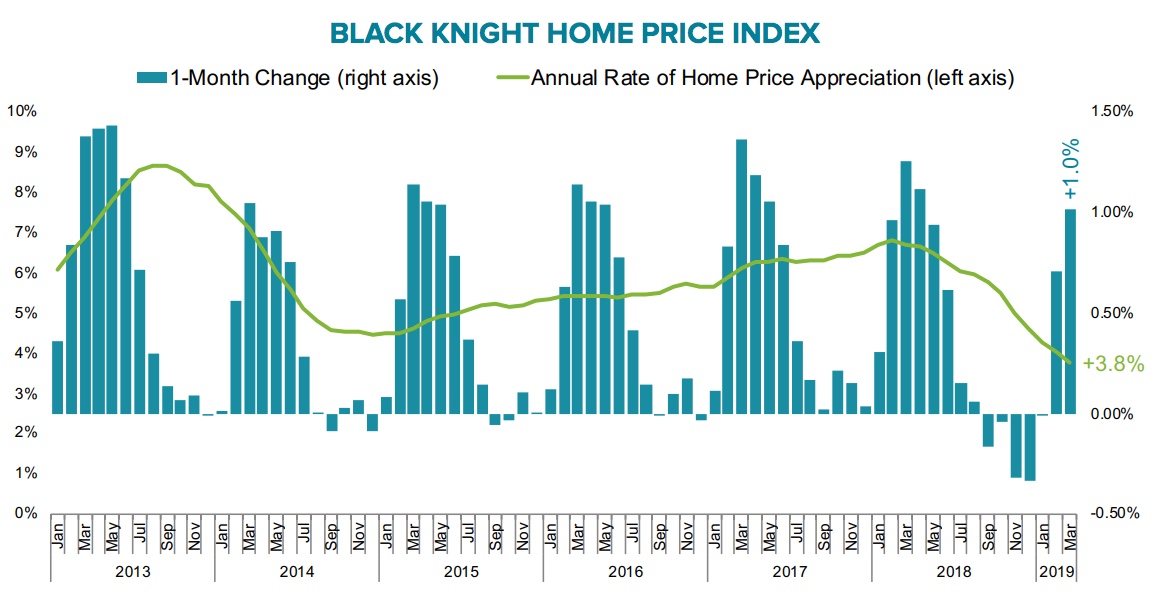
Home prices usually enjoy the largest home price gains of the year in March as the "spring market" kicks off. However, As Black Knight's Data & Analytics Division President Ben Graboske explains, in March of this year prices rose by only 1.0 percent compared to 1.25 percent the prior March. "Likewise, the annual rate of appreciation has now slipped to 3.8 percent, the first time annual home price growth has fallen below its 25-year average of 3.9 percent since 2012. That makes 13 consecutive months of home price deceleration."
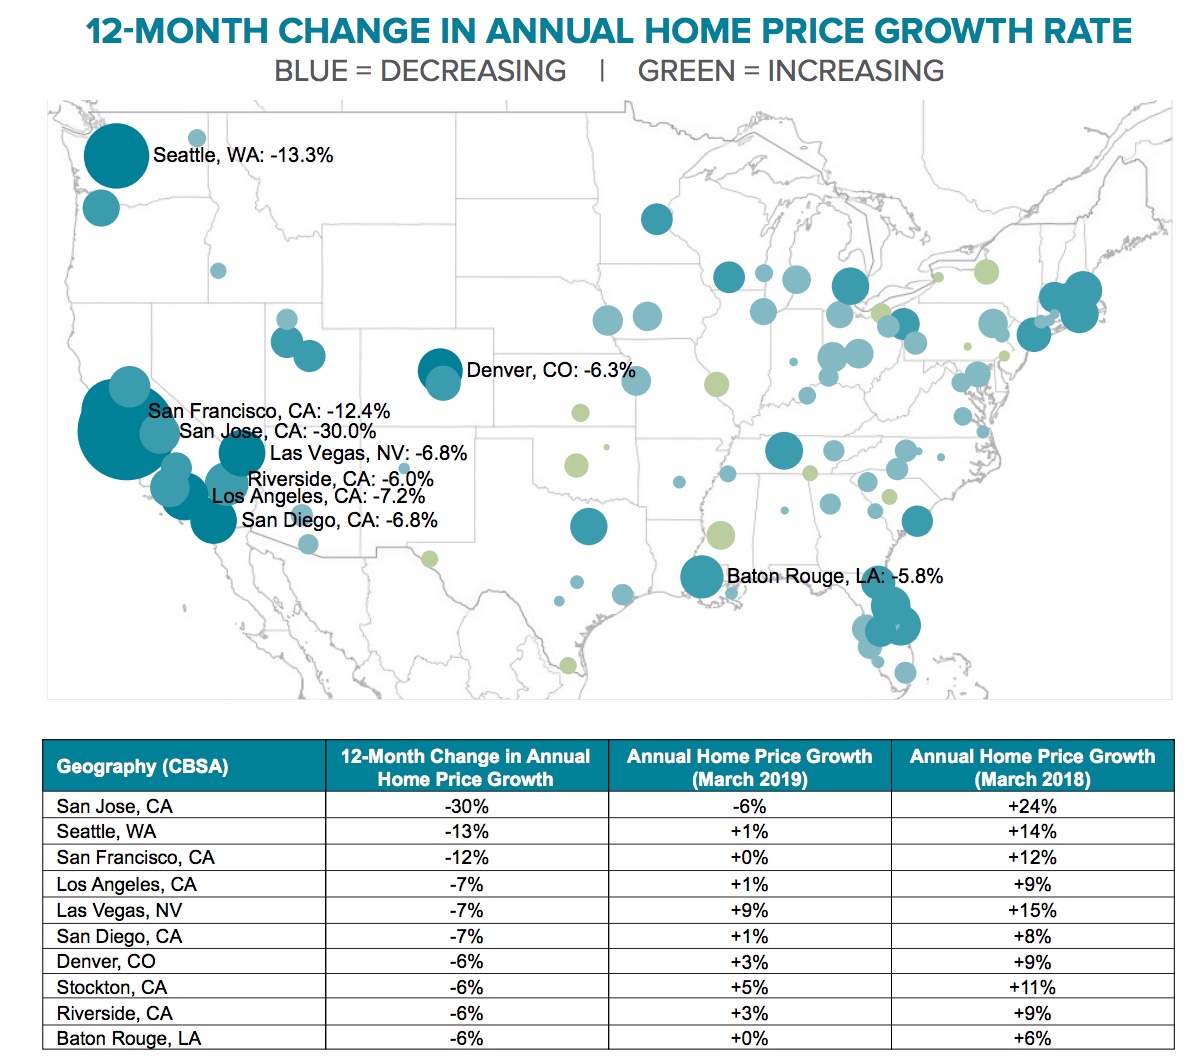
Eighty-five of the 100 largest housing markets have posted lower gains over the last year, including some very dramatic changes. San Jose's appreciation has declined by 30 percent; Seattle's by 13 percent and San Francisco's by 12 percent, dropping them from the top 1st, 2ns, and 5th gainers in the nation to numbers 100, 97, and 99 respectively. Their prior standings have been assumed by two Rocky Mountain states, Idaho and Utah, and parts of eastern Washington.
Even better news for homebuyers is that among those 85 markets where appreciation decelerated, 65 had more of a slowdown at the low end of the market than at the high end. However, that lower tier end of the market did continue to gain the faster, outpacing the high end in all but one of the 85 markets. On average, the appreciation among the bottom 20 percent of properties in terms of price (Tier 1) was 5.8 percent compared to 2.2 percent in Tier 5, the highest priced 20 percent.. The difference between those tiers however has shrunk from 4.9 percent a year ago to 3.6 percent as the lower end cools more rapidly.
The most positive result of these price changes as well as lower rates is the impact on affordability. Graboske says "Home prices began to decelerate in February 2018 as rising interest rates put pressure on affordability, intensifying toward the end of the year as 30-year fixed rates peaked near 5 percent in November, bringing affordability levels close to their long-term averages. Of course, rates have since declined, and are now hovering close to 4 percent. However, they didn't fall below 4.25 percent until the last week of March, meaning we likely won't see the impact - if any - on home prices until May or June housing numbers."
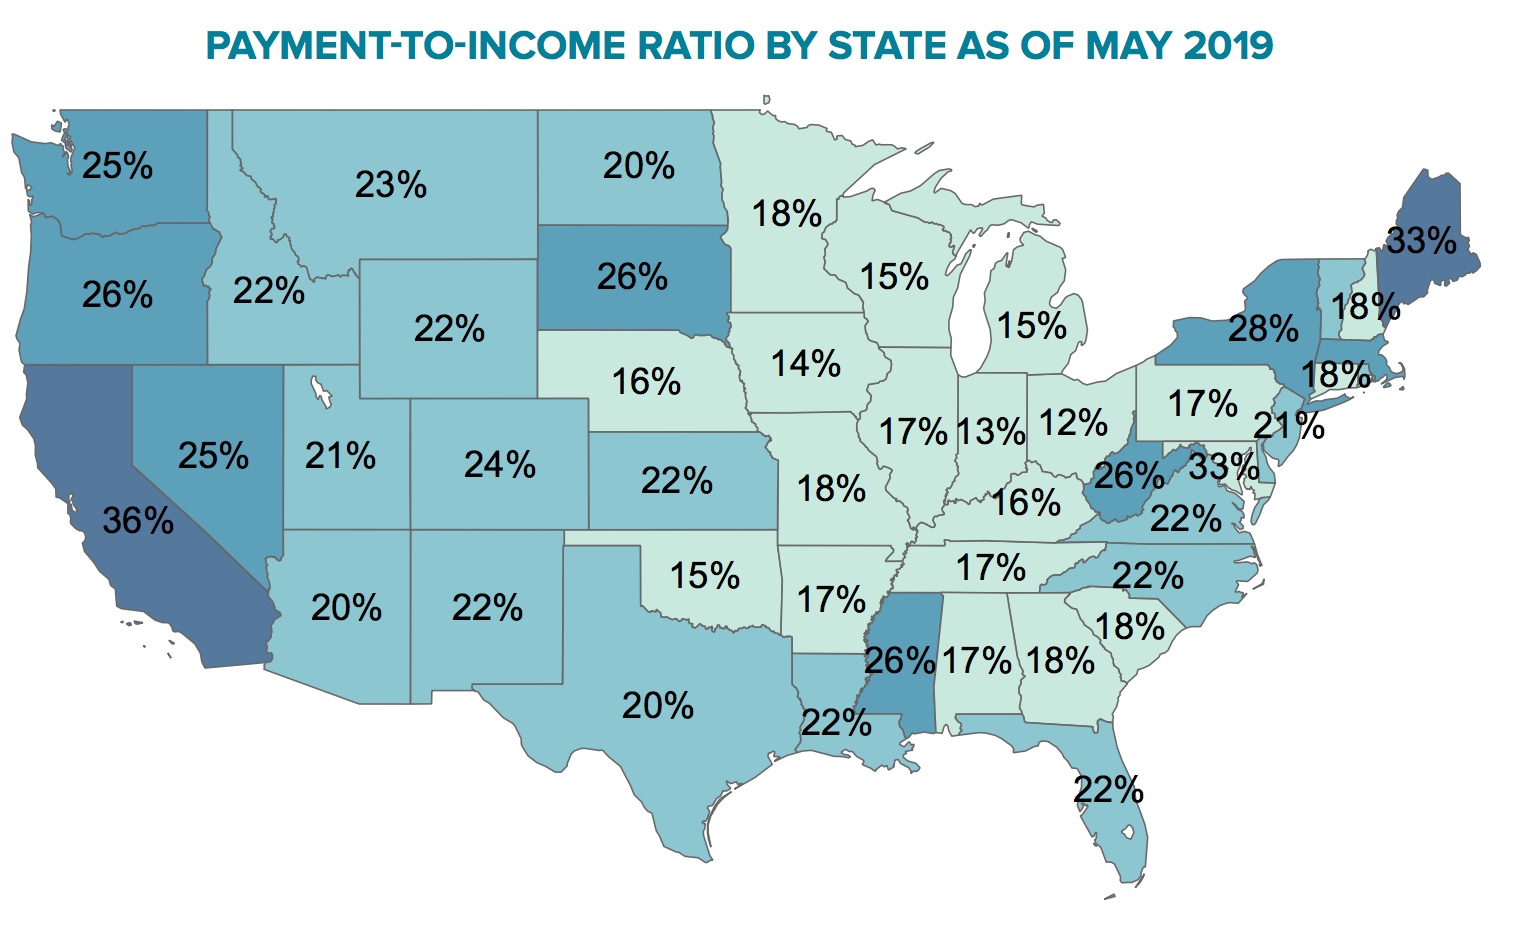
Today the monthly payment needed to purchase the average priced home with 20 percent down has declined by 6 percent over the last six months. That payment is now $1,172 per month, the lowest in more than a year. This equates to requiring 22 percent of the median income to make that payment, the lowest ratio in more than a year and well below the long-term average of 25.1 percent. That sales slowed forcing price growth lower suggests that a 25 percent ratio may not be sustainable today, perhaps because of the levels of other mortgage debt, lending standards, or other factors. In four states - California, Hawaii, Maine and Nevada - plus the District of Columbia home prices are still less affordable than their own long-term averages The disparity is most noticeable in California, where - despite interest rate declines and, in some cases, rapidly slowing home price growth - it requires 4 percent more of the median household income to buy the average-priced home. This is far less affordable than long-term benchmarks and suggests that, while falling rates may have the ability to reheat some housing markets across the country, it may not be enough to alleviate the affordability constraints that have been putting downward pressure on California housing markets.