In an earlier report covering March loan performance, Black Knight's Mortgage Monitor noted that home prices had risen more in the first two months of this year than in the same period for any year since 2005. The home price appreciation (HPA) tracked by Black Knight's Home Price Index (HPI) did moderate slightly in March, but prices still did keep climbing.
The current edition of the Monitor updates these figures and says rising prices, coupled with interest rates that are doing the same, (they had moved higher by 70 basis points by the end of May) have pushed up the monthly payment on a median priced home, bought with 20 percent down, by $150 or 14 percent over the first five months of the year. This has pushed seven states to a level of affordability that is less than their long-term norms and 12 others are coming close. The slight slowing of HPA noted in March might have been, to some extent, a reaction to tightening affordability.
Incomes have grown at a stronger than normal pace, up by an annual 4.37 percent compared to the 25-year average of 2.75 percent, but it hasn't been enough to keep up It now takes 22.8 percent of the median income to make the monthly mortgage payment on a median priced home, the largest share since the 2010 home-buying season, but still below long-term benchmarks. At the 2012 market bottom, the income required was 17.3 percent of the median.
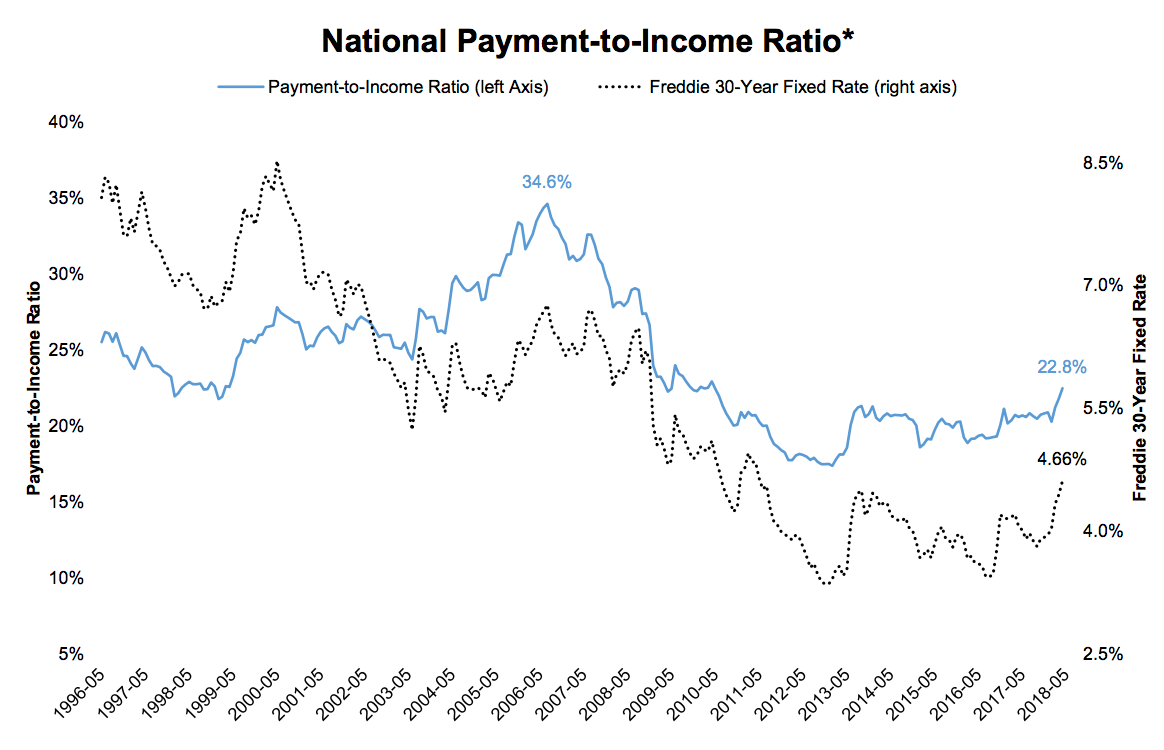
To come up with current affordability numbers, Black Knight extrapolated 2017 and 2018 income gains from 2016 Census data and rolled HPA forward at its current annual rate from March through May and used Freddie Mac's 30-year fixed rate as of May 24, 4.86 percent while noting a 10-basis point decrease since then.
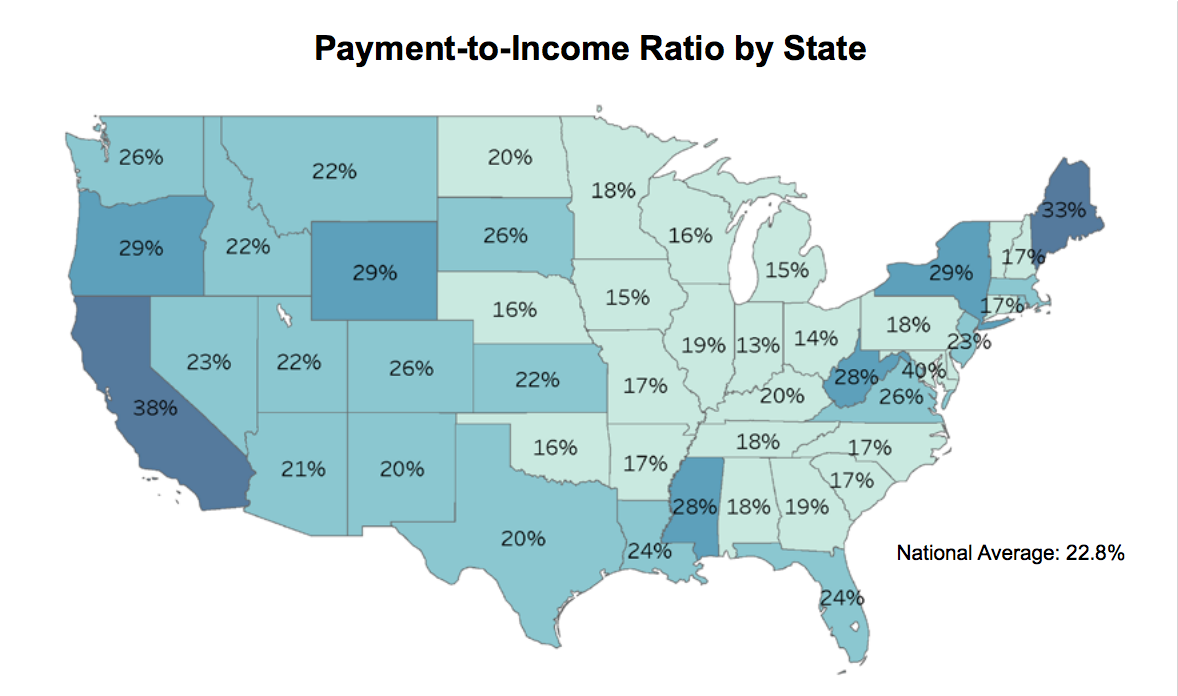
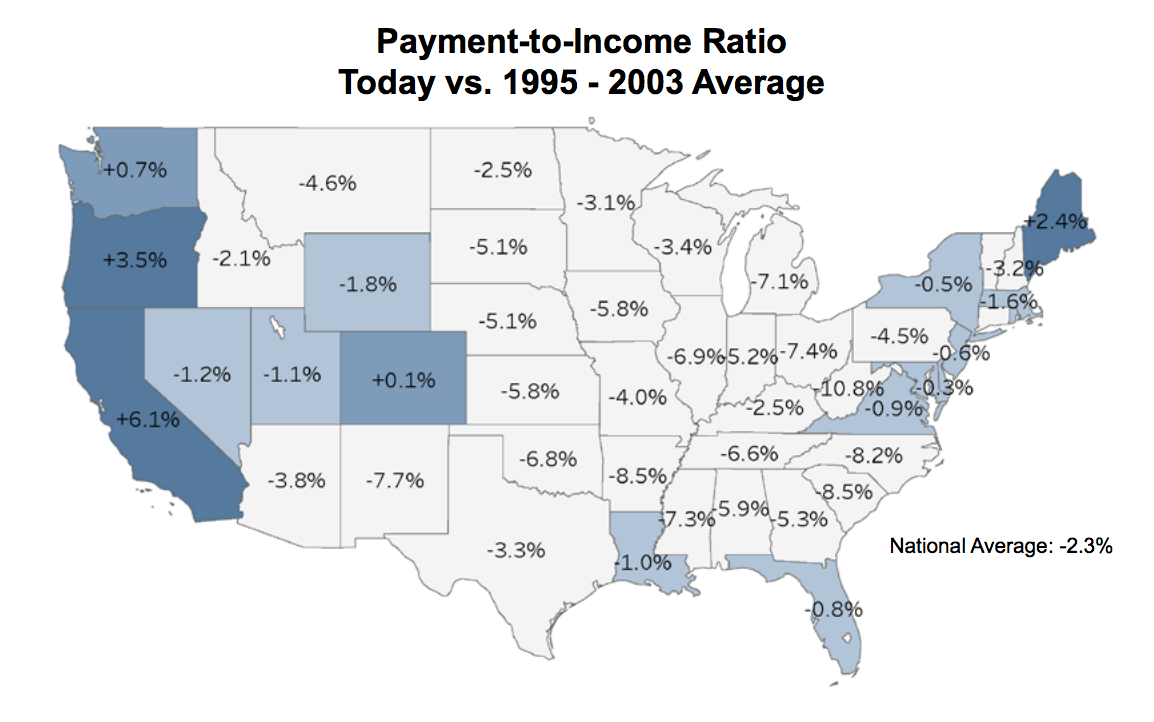
The seven states that are less affordable than their long-term averages from 1995 to 2003 are led by Washington DC, where the required percentage of the median income is 7 percent higher at 40 percent. It is followed by California (38 percent), Hawaii (35 percent) and Maine (33 percent) Likewise, 14 states now have payment-to-income ratios higher than the national average of 23%. On the other hand, Black Knight found 15 states where affordability is greater than long term norms by at least 6 percent.
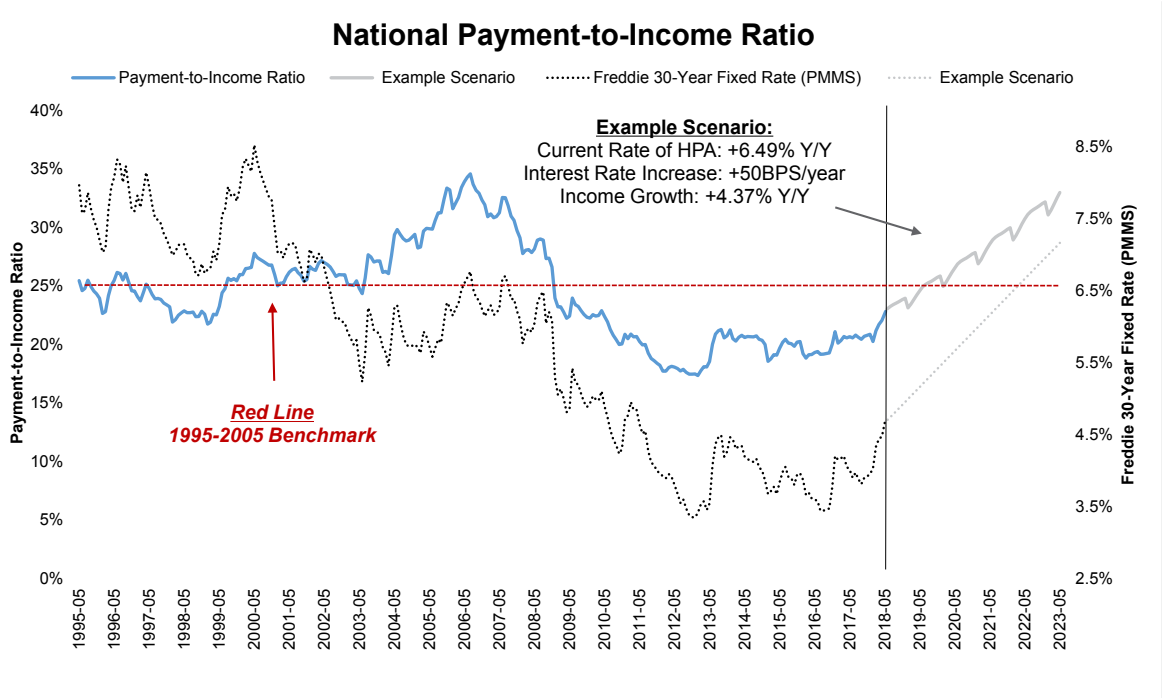
Black Knight clearly considers the current path of home prices, interest rates, and incomes unsustainable from an affordability perspective and lays out three possible scenarios as to how affordability might play out over the next five years.
In the first example, they assume that HPA continues at the same rate as today, 6.5 percent, and income growth stays steady at 4.37 percent, the current three-year average. Both those numbers are higher than long term norms. Interest rates are assumed to increase 50 basis points each year, well below what they are on track to do this year. Under this scenario, the national payment-to-income ratio would hit long-term norms in just over a year an all-time high in just over five years.
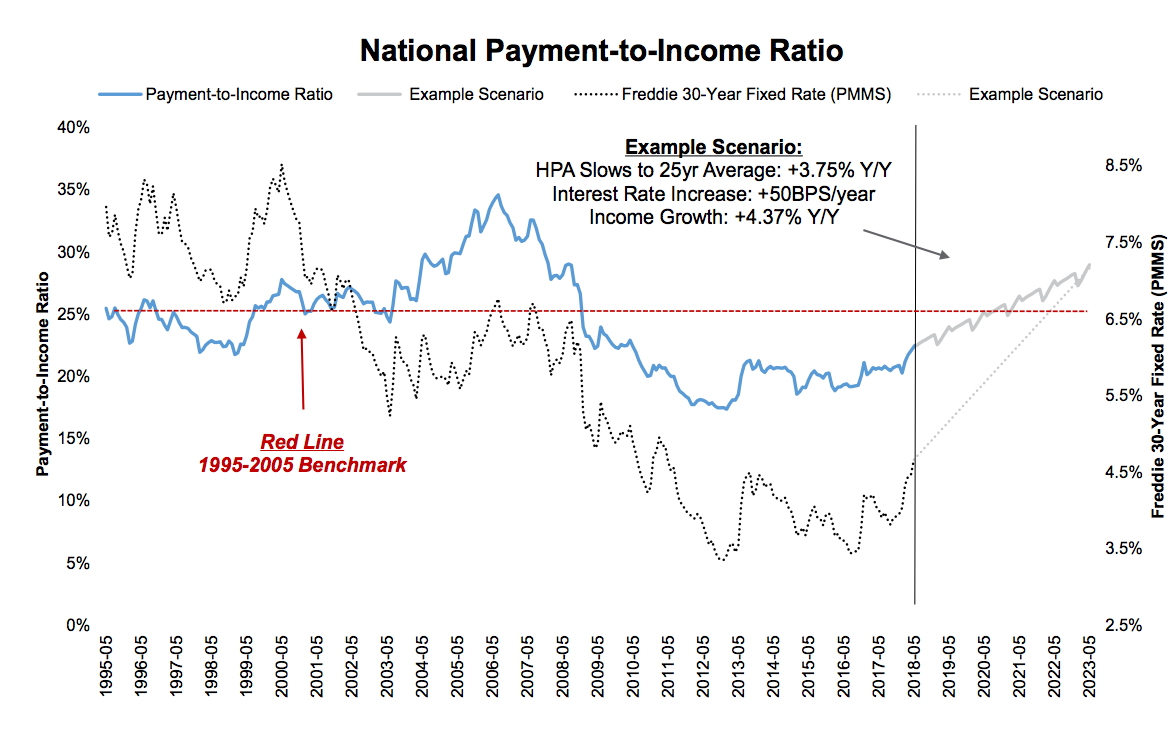
In the second scenario the interest rate and income are held steady, but HPA is slowed to the long-term average of 3.75 percent. Long-term affordability norms would be reached in about two years and after five years it would require nearly 30 percent of the median income to purchase the median home. This is nearly 5 percent above long-term norms and likely unsustainable.
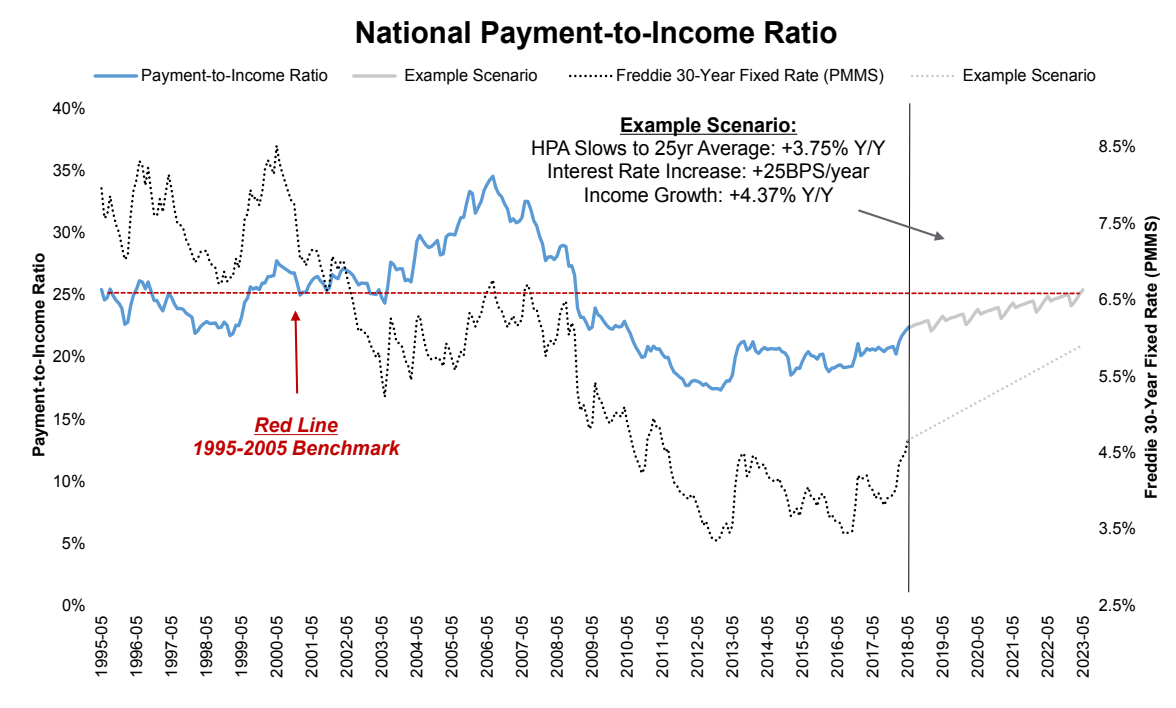
In the final exercise, Black Knight holds HPA at the long-term rate of 3.75 percent, slows rate increases to 25 basis points a year but uses the current income growth of 4.37 percent. This is more sustainable over the long run, keeping on par with long term affordability norms at the five-year mark.
Black Knight concludes that while there is still some breathing room at the national level before reaching long-term affordability norms, it is important to remember that certain states have already arrived there, even before factoring any additional increases in home prices or interest rates.
The Monitor also looked at the first quarter 2018 first mortgage originations. These totaled $378.1 billion of which $230.6 billion were purchase loans and $147.6 billion were for refinancing. This was a decline of 20 percent in overall volume when compared to the fourth quarter of 2017, and a 6 percent decrease from the first quarter of that year.
Purchase mortgages were 17 percent lower on a quarter over quarter basis, which Black Knight called seasonal, while refinancing was down 24 percent. Refinancing drove the year-over-year decline; it was down 19 percent, only partially offset by a 5 percent increase in purchase lending. The refinancing share of originations declined from 45 percent in the first quarter of 2017 to 41 percent in the fourth and to 39 percent in the first quarter of this year.
The volume of purchase loans has increased in 26 of the last 27 quarters, but the rate of that growth has slowed. In late 2015 purchasing lending was increasing year-over-year by 25 percent but has fallen to less than 10 percent in each of the most recent three quarters. If fact, the 5 percent annual increase posted in the first quarter of this year was the lowest growth rate since early 2014. Black Knight says this is likely due to normalization of growth but also to headwinds from the tight housing inventory.
Even though the dollar volume in Q1 was the largest in 11 years, and even with 17 quarters continuous growth in purchase lending, the volume is still early 25 percent lower than in 2006.