The Urban Institute (UI) releases a regular report, Housing Finance at a Glance, a "chartbook" loaded with charts and commentary on mortgage activity. Much of the May chartbook's material, is retrospective, reaching back as far as Q4 2019 where there is a time lag in data collection. Much of it, residential construction data, home price indices, negative equity reports, etc., has been covered by MND from original sources, but we have cherry-picked a few items that may have otherwise escaped your and our notice.
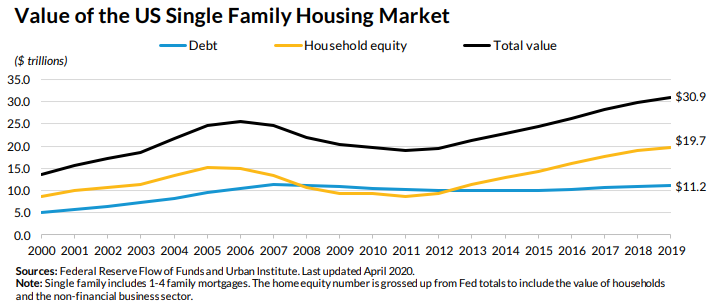
The total value of the housing market, as outlined in the Federal Reserve's Flow of Fund Report has gradually increased since 2012, driven primarily by growing home equity. The Q4 2019 numbers show that while total home equity was steady this during that quarter at $19.7 trillion, mortgage debt outstanding grew slightly from $11.1 trillion in Q3 to $11.2 trillion in Q4, bringing the total value of the housing market to $30.9 trillion. This is 20.7 percent higher than the pre-crisis peak in 2006. Agency MBS account for 61.6 percent of the total mortgage debt outstanding, private-label securities make up 3.9 percent, and unsecuritized first liens 30.0 percent. Home equity loans comprise the remaining 4.5 percent of the total.

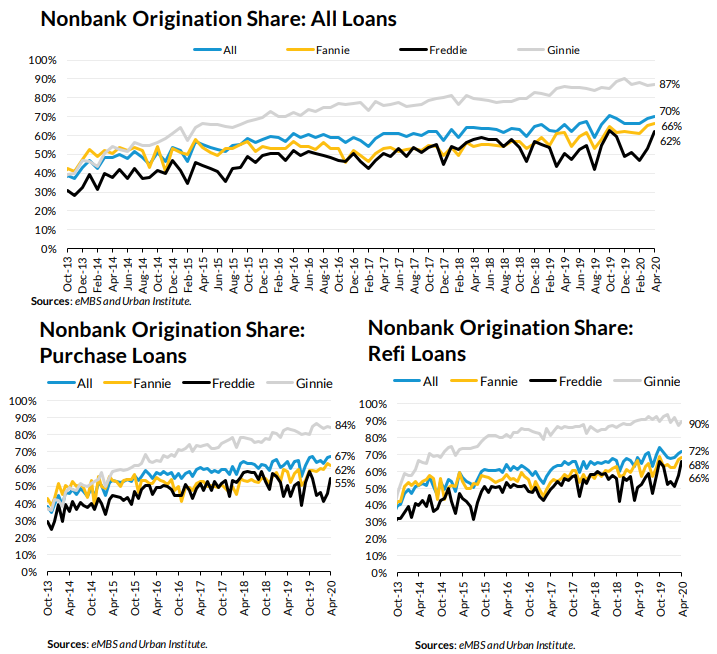
Nonbank agency originations have also been rising steadily since the housing recovery really took hold in 2013 and by April of this year this nonbank share stood at 70 percent. The GinnieMae nonbank share has been consistently higher than the GSEs, rising slightly in April 2020 to 87 percent. Fannie and Freddie's nonbank shares grew to 66 and 62 percent, respectively (note that these numbers can be volatile on a month-to-month basis.) Ginnie Mae, Fannie Mae and Freddie Mac all have higher nonbank origination shares for refi activity than for purchase activity.
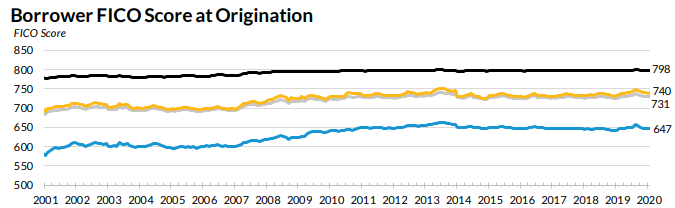
Credit access heading into the COVID-19 pandemic was already tight, especially for those with lower FICO scores. The March 2020 data reflect mortgage application activity in January and February, before any pandemic impact and the median FICO for purchase loans was about 40 points higher than the pre-housing crisis level of around 700. The 10th percentile, which represents the lower bound of creditworthiness to qualify for a mortgage, was 647 in this data, high compared to low-600s pre-bubble. The median LTV at origination of 95 percent also remains high, reflecting the rise of FHA and VA lending. Although current median DTI of 39 percent exceeds the pre-bubble level of 36 percent, higher FICO scores serve as a strong compensating factor.
With the Fannie Mae and Freddie Mac portfolios well below the $250 billion size they were required to reach by year end 2018, the strategies of the two GSEs have diverged. Fannie is continuing to shrink its portfolio; it contracted by 12.7 percent between March 2019 and March 2020. By contrast, Freddie has held its portfolio constant; it has actually increased by 0.9 percent over the same period. Both GSEs are continuing to shrink their less liquid assets (mortgage loans, non-agency MBS).

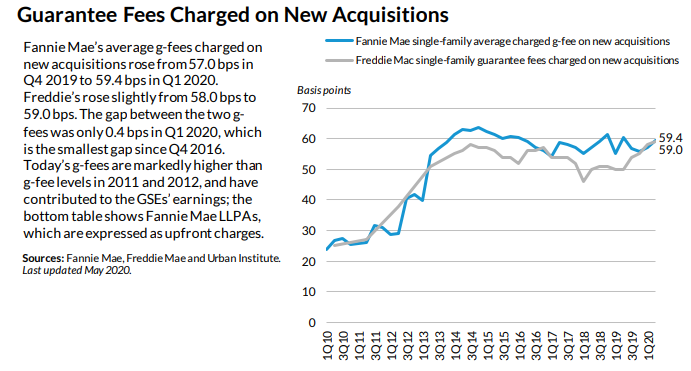
Fannie Mae's average g-fees on new acquisitions rose from 57.0 bps in Q4 2019 to 59.4 bps in Q1 2020 while Freddie Mac's rose from 58.0 bps to 59.0 bps. The gap between the two sets of fees was only 0.4 bps in Q1 2020, the smallest since Q4 2016. Today's g-fees are markedly higher than g-fee levels in 2011 and 2012 and have contributed to the GSEs' earnings.
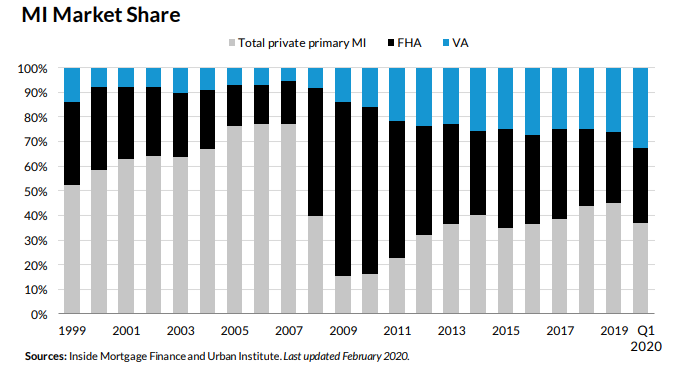
Overall mortgage insurance activity via the FHA, VA and private insurers increased by 93.1 percent between the first quarters of 2019 and 2020, even as the private insurance numbers declined. The total value of that insurance grew to $259 billion in the first quarter of 2020 from $134 billion a year earlier. In the first quarter of 2020, the value of private mortgage insurance written decreased by $15.88 billion compared to the previous (Q4 2019) quarter while that written by FHA and the VA increased by $3.32 billion and $6.89 billion, respectively. During that period, the VA share grew from 29.1 to 31.9 percent and the FHA share increased from 28.6 to 30.0 percent. The private mortgage insurers' share fell significantly, from 42.3 to 36.3 percent compared to the previous quarter.