
The National Association of Home Builders (NAHB) is introducing the latest in a series of indices it has employed to measure housing within a broader context of the economy. The first in our memory was the Improving Markets Index (IMI), introduced early in the recession and using 2007 as a benchmark to determine the post-downturn recovery of hundreds of cities and towns. This index was retired sometime in 2012 or 2013 and replaced by the Leading Markets Index (LMI) which switched the focus to the progress of communities in regaining their own (pre-recession) levels of activity. Both used three data sets for the assessment; Bureau of Labor Statistics employment data, Freddie Mac information on home prices, and U.S. Census counts of single-family housing permits. Now the LMI has been shelved (not sure exactly when, as we retired our coverage of it quite some time ago) and this week NAHB unveiled its replacement, the Home Building Geography Index (HBGI).
The HBGI uses U.S. Census Bureau counts of county-level building permit data, both single and multifamily, to segment the United States housing market. According to the first Eye-on-Housing blog post about the index written by Litic Murali, subsequent posts will have "several, mutually exclusive categories into which the 3,221 counties are methodically delineated."
The first cut, for the first quarter of this year, is a region-based delineation of the counties, with each region differentiated from each other by population density. This resulted in seven regions, Large Metro - Core County, highly urbanized areas; Large Metro - Suburban County, inner and outer suburbs of larger metropolitan areas; Large Metro - Outlying County, exurbs of larger metropolitan areas; Smaller Metro - Core County, urbanized areas and inner suburbs of small metropolitan areas; Smaller Metro - Outlying County, outer suburbs of small metropolitan areas; Micro county, small towns; and Non Metro/Micro County, rural areas.
The initial analysis focuses on the trends in single- and multifamily construction as they occurred in the "exurbs" (categorized as Large Metro - Outlying County above.) Most serve as commuter towns and enable more affordable construction due to greater availability of land.
Although the exurbs have only a small share of permit activity and single-family permit activity consistently exceeds that for multifamily construction, their first quarter annual growth rate in single-family permit activity was high at 1.6 percent. The annual growth of 5.6 percent was the highest among the regional geographies in the HBGI.
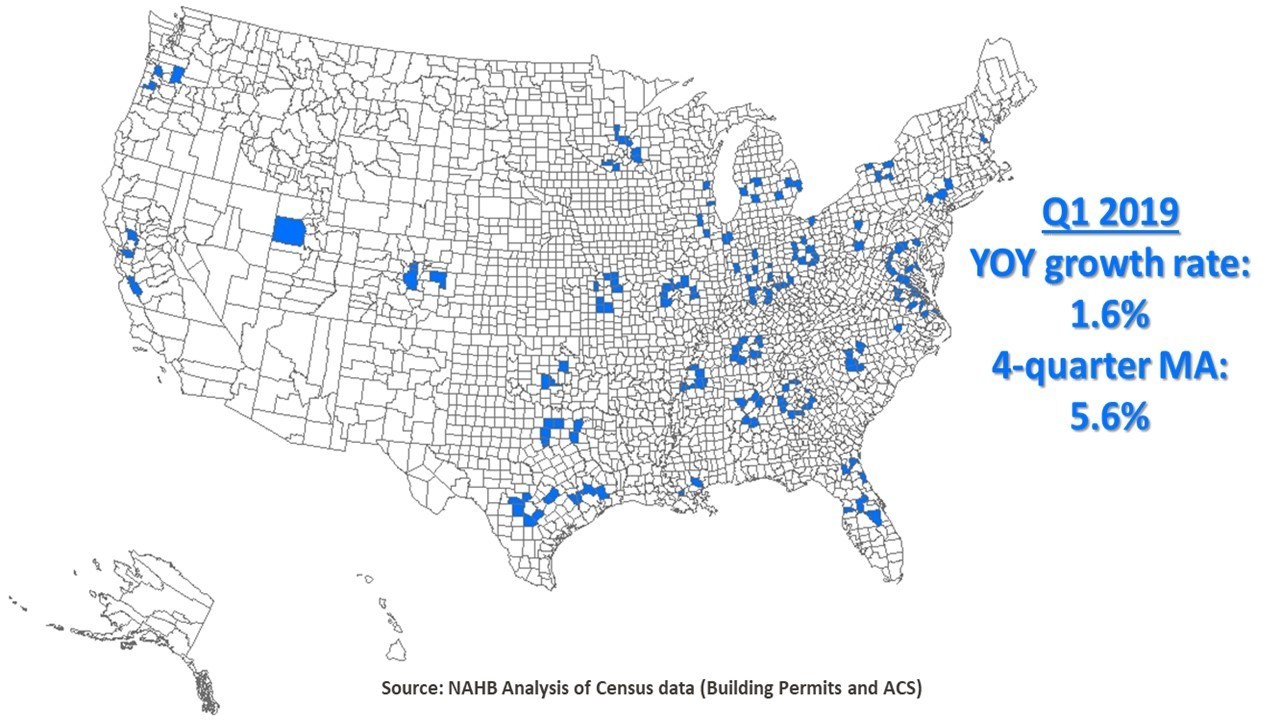
When interest rates increased in 2018 housing affordability hit a 10-year low on the NAHB/Wells Fargo Housing Opportunity Index. The lower priced housing in the exurbs tends to be less sensitive to price changes and were not as impacted by the higher rates as the closer-in suburbs. As land is generally more available and cheaper in exurbs than suburbs, permitting increased in an otherwise challenging quarter.
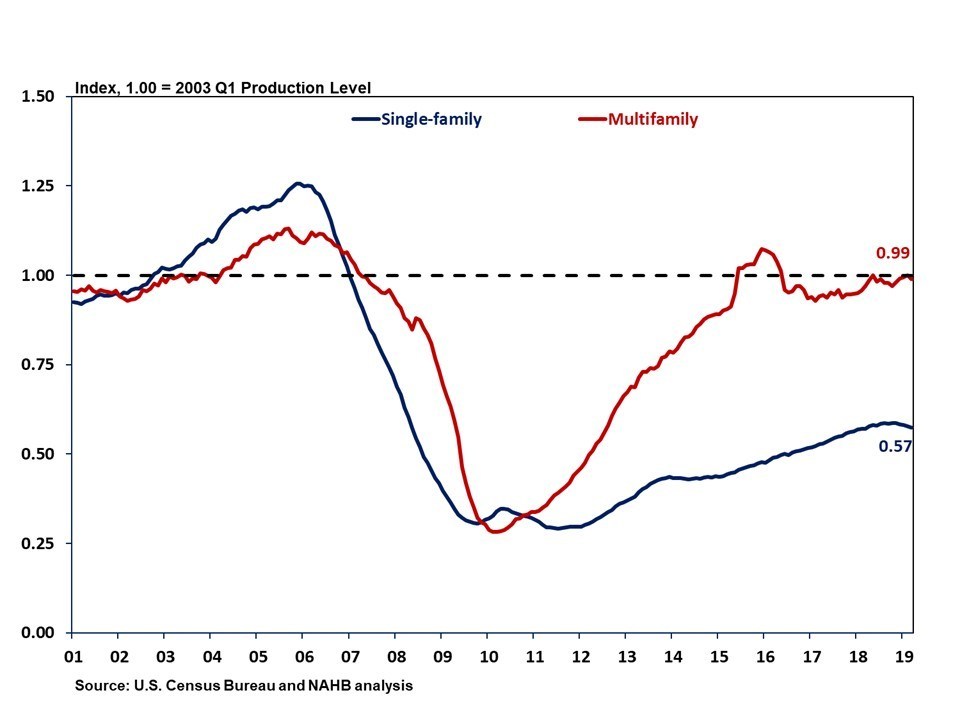
Murali says that, geography aside, it is important to consider where home building is today in comparison to the period before the housing boom that preceded the financial crisis of 2008 and the Great Recession. The first quarter of 2003 is a good point to compare the current single- and multifamily national permit levels.
As of the first quarter of 2019, single-family permit activity, adjusted for population, registered at 57 percent of that in the first quarter of 2003. This share relative to 2003 was unchanged from the fourth quarter of 2018. Additionally, multifamily permit activity, adjusted for population was at 99 percent of the first quarter of 2003 level, up from 96 percent the prior quarter.
Turning to multi-family permitting, Murali says economic theory suggests that apartment construction should expand first in high population, high land-cost areas and then move to lower-cost markets over the course of a business cycle. The expected trends are reflected in HBGI data which shows 40 percent of apartment construction in the first quarter was in the category of large metropolitan area core counties. Another 26 percent in large metro suburbs and 21 percent in small metro cores. The remaining 13% was spread out across exurbs, small towns, and rural areas.
But the data also shows some apartment construction moving to outlying areas with lower population density. For example, there was deceleration in the four-quarter moving average growth rates of construction in those areas where most of it takes place. In large and small metro core areas the rates declined by 1.2 percent and 0.2 percent respectively and by 4.4 percent in large metro suburbs. In contrast, double-digit gains for growth were recorded in the exurbs, small city suburbs and some rural areas.
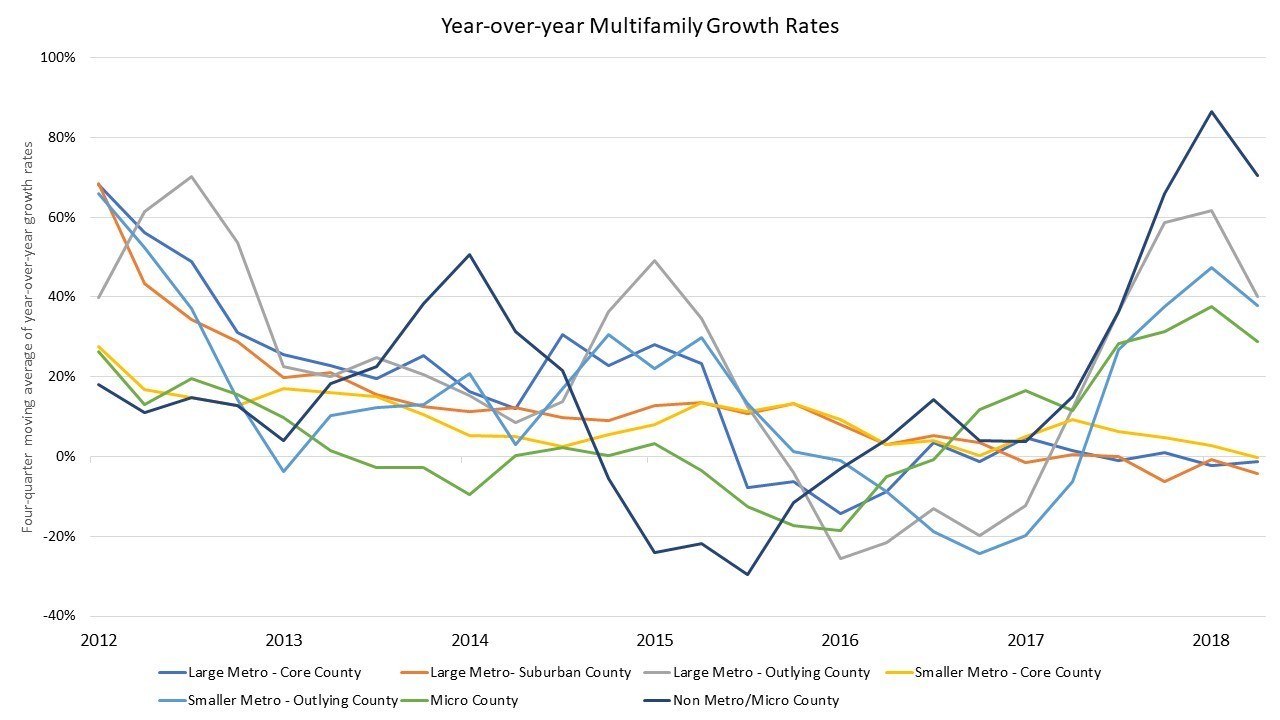
While challenging housing affordability conditions at the end of 2018, which slowed single-family construction, had an impact on where apartment construction is taking place the first quarter 2019 data gives some limited indications the moving average may change direction again. Core counties of large and small metro areas posted a quarterly increase (first quarter 2019 compared to first quarter 2018 permit activity), as demand for rental units increased going into 2019.


