
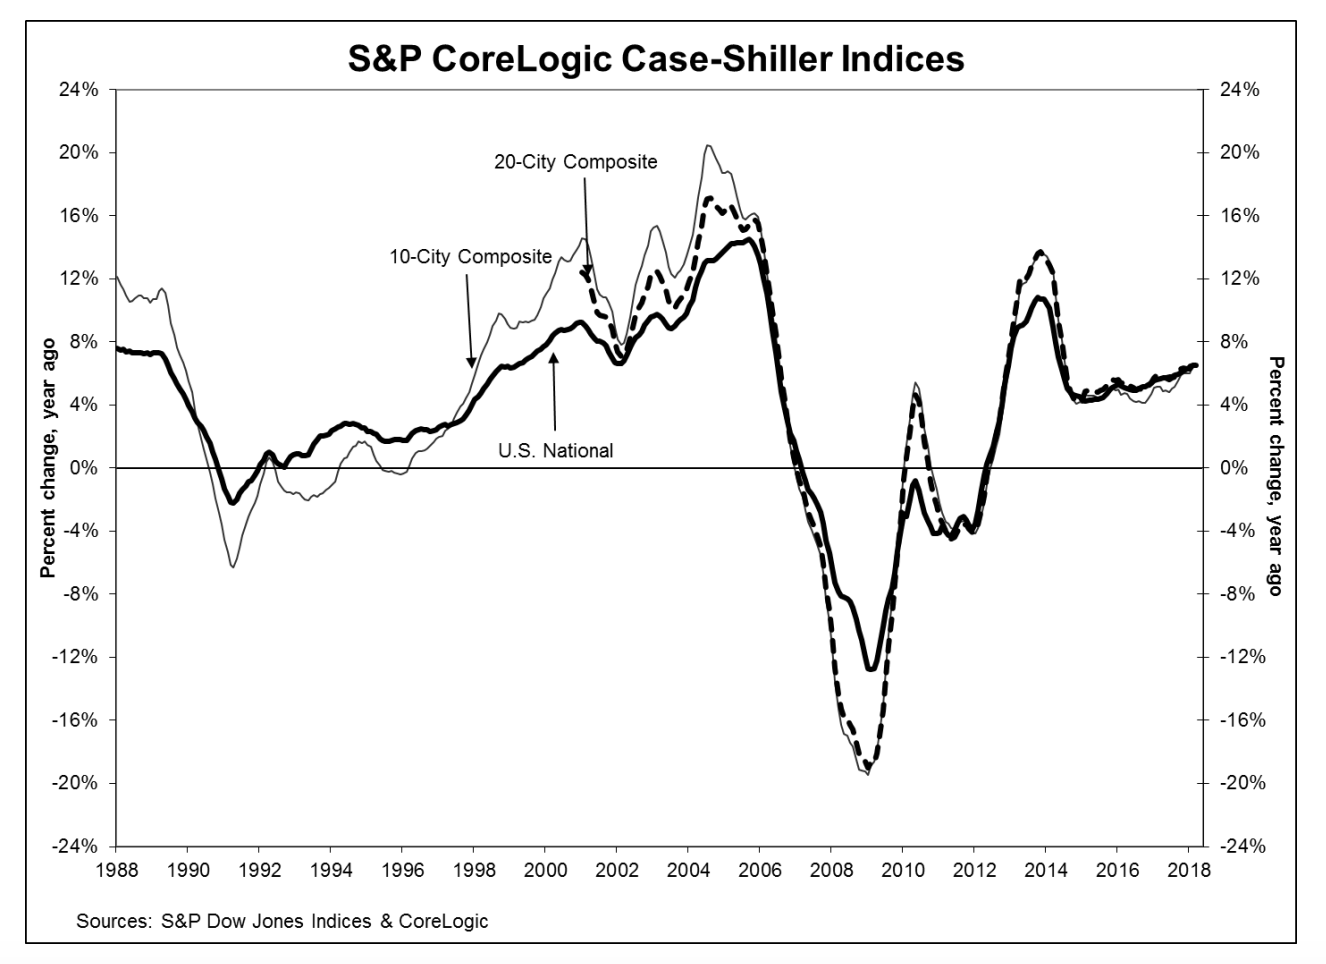
It certainly must save time in the S&P CoreLogic Case-Shiller press office that they can reuse essentially the same headline month-after-month. This month it was "HOME PRICES NOT SLOWING DOWN." That is backed up by the Case-Shiller U.S. National Home Price NSA Index which covers all nine U.S. census divisions. It reported a 6.5 percent annual gain in March, the same as was reported for February.
Likewise, the two composite indexes. The 10-City reported a 6.5 percent gain compared to 6.4 percent in February while the 20-City increase was unchanged at 6.8 percent.
The top three cities in terms of annual appreciation were again Seattle, with a 13.0 percent year-over-year gain while Las Vegas came in at 12.4 percent and San Francisco moved up by 11.3 percent. Twelve of the 20 cities reported greater price increases in the year ending March 2018 versus the year ending February 2018.
On a month-over-month basis and before seasonal adjustment, the National Index was up 0.8 percent and the 10-City and 20-City Composites reported increases of 0.9% and 1.0%, respectively. After seasonal adjustment, the National Index recorded a 0.4% month-over-month increase in March and the 10-City and 20-City Composites posted 0.4% and 0.5% month-over-month increases, respectively. All 20 cities reported increases in March before seasonal adjustment, while 19 of 20 cities reported increases after seasonal adjustment.
David M. Blitzer, Managing Director and Chairman of the Index Committee at S&P Dow Jones Indices provided the following analysis. "The home price increases continue with the National Index rising at 6.5 percent per year" he said. "Seattle continues to report the fastest rising prices at 13 percent per year, double the National Index pace. While Seattle has been the city with the largest gains for 19 months, the ranking among other cities varies. Las Vegas and San Francisco saw the second and third largest annual gains of 12.4 percent and 11.3 percent. A year ago, they ranked 10th and 16th. Any doubts that real, or inflation-adjusted, home prices are climbing rapidly are eliminated by considering Chicago; the city reported the lowest 12-month gain among all cities in the index of 2.8 percent, almost a percentage point ahead of the inflation rate.
"Looking across various national statistics on sales of new or existing homes, permits for new construction, and financing terms, two figures that stand out are rapidly rising home prices and low inventories of existing homes for sale. Months-supply, which combines inventory levels and sales, is currently at 3.8 months, lower than the levels of the 1990s, before the housing boom and bust. Until inventories increase faster than sales, or the economy slows significantly, home prices are likely to continue rising. Compared to the price gains of the last boom in the early 2000s, things are calmer today. Gains in the National Index peaked at 14.5 percent in September 2005, more quickly than Seattle is rising now."
As of March 2018, average home prices for the MSAs within the 10-City and 20-City Composites are back to their winter 2007 levels. Both the National and the 20 City Composite have now passed their pre-crash peaks, the National Index by 7.8 percent and the larger composite by 1.0 percent. The 10-City still lags its July 2006 peak by 1.7 percent.
The S&P CoreLogic Case-Shiller Home Price Indices are constructed to accurately track the price path of typical single-family home pairs for thousands of individual houses from the available universe of arms-length sales data. The National U.S. Home Price Index tracks the value of single-family housing within the United States. The indices have a base value of 100 in January 2000; thus, for example, a current index value of 150 translates to a 50 percent appreciation rate since January 2000 for a typical home located within the subject market.
The National Index set another new record high in March 198.94, up from the previous month's peak of 197.01. The 10- and 20-City Composites had readings of 222.52 and 208.62 respectively. Los Angeles claims the highest index reading at 278.27. Cleveland had the lowest reading at 118.20.


